The recommended projects in this issue are mainly designed for the collection, transmission, and storage of massive logs (second-level gigabytes).
Project Introduction
Different from traditional packages such as ELK series suites, this project mainly aims to solve the problems of high hardware cost and low performance caused by a large number of logs (entry and exit parameters, link trace logs) from collection to final retrieval and query.
Compared with common ELK solutions such as Filebeat, MQ transfer, and ES storage, this framework has more than 10 times the performance improvement and more than 70% disk savings. This means that with the same hardware configuration, only 100 MB of logs per second can be transmitted and stored, but this solution can process 1 GB of logs per second, and the disk space occupied by the whole link due to logs can be reduced by 70%.
background
In order to ensure the robustness of the system, the traceability of requests, and the troubleshooting of problems after problems, we usually save the user request from the entry and exit parameters, the logs of key nodes in the middle of the system (info, error), link logs, etc., and will save the logs for a period of time.
The log system is basically divided into several modules: collection (such as filebeat and logstash), transmission (Kafka and TCP), storage (ES, MYSQL, HIVE, etc.), and query (Kibana and self-built).
Taking the traditional log solution as an example, when a gigabyte of logs is generated, the logs are written to the local disk (occupying 1 GB of disk), read and write to mq (mq occupies 2 Gbit/s, single backup), and consume mq to write to es (es occupies 1 Gbit/s), which occupies a total of 4 GB of disk, which is accompanied by network bandwidth occupation and server resource occupation of the same size (100 Mbit/s processing per second for a single server).
With the size of JD App, when 100 G logs are generated in seconds, the hardware resources consumed are quite huge, and the cost has reached an unbearable point.
As mentioned above, the solution increases the log throughput by 10 times compared with the Filebeat+MQ+ES mode under the same hardware configuration, and the full-link disk occupation is reduced by more than 70%.
Brief introduction of the solution

From this general process, in fact, we can easily see that we have experienced a lot of reads and writes, and each read and write is accompanied by the read and write of the disk (including MQ is also written to the disk), and frequent serialization and deserialization, as well as doubling the network IO.
We found that it is not necessary to write local disk and MQ, we can write log data to local memory, and then make a thread to send the log directly to the worker through UDP on a regular basis.
After the worker receives it, it parses it, writes it to its own memory queue, and then starts several asynchronous threads to write the data of the queue to the ClickHouse database in batches.
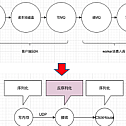
Log collection system

The basic process is to collect the logs printed in the middle of the process by obtaining the web request entry and exit parameters, custom log4j, and logback appender through the filter, correlate it with the tracerId generated at the request entry, write it to local memory (instead of writing disk), compress it (reduce the string space occupation by more than 80%), send it to the worker side through Udp (replace MQ), and the worker receives the data and extracts the index field. Except for the index fields to be used for future queries, the content is compressed until it is stored in the database.
Configuration Center: It stores the IP address of a worker and allows the client to obtain the IP address of the worker cluster assigned by its module.
client: After the client starts, it pulls the IP address of the worker cluster assigned to its module from the configuration center, polls and compresses the collected logs, and sends them to UDP.
worker: Each module will allocate a different number of worker machines, and report its own IP address to the configuration center after starting. After receiving the logs from the client, parse the corresponding fields and write them to the ClickHouse database in batches.
ClickHouse: A powerful database with a high compression ratio, extremely strong write performance, sharding by day, and good query speed. It is ideal for logging systems with a large amount of writes and a small number of queries.
Dashboard: A visual interface that displays data from ClickHouse to users, with multi-condition and multi-dimensional query functions.

Aggregate logs on the client side
(1) Requested entry and exit parameters
If it is an HTTP web application, the easiest way to get the entry and exit parameters is through a custom filter. A filter is defined in the SDK of the client, and the access party can collect the entry and exit parameters by configuring the filter to take effect.
If it is a non-HTTP request from other RPC applications, a corresponding filter interceptor is also provided to obtain the entry and exit parameters.
After obtaining the input and input parameters, the SDK compresses the large packets, mainly the input parameters, and defines the entire data as a JAVA object, serializes it protobuf, and polls and transmits it to its corresponding worker cluster through UDP.
(2) Some key information printed by yourself on the link, such as calling the entry and exit parameters of other systems, and some information and error information printed by yourself
The SDK provides custom appenders for log4j, logback, and log4j2 respectively, and users can define my custom appender in their own log configuration files (such as logback.xml), so that all the info, error and other logs printed by subsequent users in the code will execute this custom appender.
Similarly, this custom appender also staging the logs in memory and then sending them out to the worker over asynchronous UDP.
Workers consume logs and store them in the database
The worker side is the focus of tuning, because it needs to receive a large number of logs sent by clients, parse them and put them into the database, so the worker needs to have a strong buffering ability.
Through online applications and rigorous stress testing, such a stand-alone docker container can process 1-50 million lines of raw logs per second, for example, a user request generates a total of more than 1,000 lines of logs in the middle, then such a single worker can handle 20,000 client QPS per second. If you write to a clickhouse database, you can write more than 200 Mbit/s per second.
Multi-Criteria Query Console
Do a good job of sharding data, such as sharding by day. Using the prewhere query function can improve performance. Do a good job in the design of index fields, such as the time and PIN commonly used for searching.