The HertzBeat recommended in this issue is an easy-to-use and user-friendly high-performance monitoring alarm system.
Project Description
HertzBeat supports custom monitoring, only by configuring YML files we can customize the required monitoring types and indicators to meet common personalized needs.
HertzBeat Modular, manager, collector, scheduler, warehouse, alerter module decoupling, easy to understand and custom development.
HertzBeat supports more liberal alarm configuration (calculation expression), supports alarm notification, alarm template, email nail wechat flying book and other timely notification delivery.
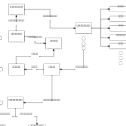
Module
- manager Provides basic services of monitoring and management and system management
Provides monitoring management, monitoring application configuration management, system user tenant background management, etc.
- collector Provides monitoring data collection services
Remote acquisition of peer indicator data using a common protocol.
- scheduler Provides monitoring task scheduling service
Collection task management, scheduling and distribution of one-time and periodic tasks.
- warehouse Provide monitoring data warehousing services
Collection index results data management, data drop, query, calculation and statistics.
- alerter Provide alarm service
Alarm calculation triggers, monitoring status linkage, alarm configuration, and alarm notification.
- web-app Provides visual console page

Fast start
Deployment of dependent services
HertzBeat relies least on relational database MYSQL5+ and sequential database TDengine2+
HertzBeat installation
HertzBeat supports installation and deployment through source code installation, Docker container operation and installation package.
Fast installation in Docker mode
docker run -d -p 1157:1157 -v /opt/application.yml:/opt/hertzbeat/config/application.yml --name hertzbeat tancloud/hertzbeat:[version tag]< Installation by installation package
- Download the installation package for your system environment
https://gitee.com/dromara/hertzbeat/releases- < li data – track = “25” > configuration HertzBeat HertzBeat/config/application configuration file. Yml < / li >
- Start deployment $./startup.sh
User-defined monitoring
Configure the custom monitoring type Two YML files need to be added
- Monitoring configuration definition file named after the monitoring type – for example, example.yml must be located in the installation directory /hertzbeat/define/app/
- Monitor parameter definition file named after the monitor type – for example, example.yml must be located in the installation directory /hertzbeat/define/param/
- By restarting the hertzbeat system, we have adapted a new custom monitoring type.
< Monitoring configuration definition file
example: Create a user-defined monitoring type named example to collect indicator data using HTTP.
File name: example.yml located in /define/app/example.yml
# This monitoring type belongs to: service- Application service monitoring DB-Database monitoring custom- Custom monitoring OS-Operating system monitoring
category: custom
# Monitor application type (consistent with file name) eg: linux windows tomcat mysql aws...
app: example
name:
      en-CN :  Simulation application type
     en-US: EXAMPLE APP
# Parameter map. These are input variables, that is, they can be written as ^_^host^_^ in the following configuration, and the system automatically replaces the  variable values.
# type is the parameter type: 0-number number, 1-string plaintext string, 2-secret encrypted string
# Force fixed mandatory parameter -host
configmap:
  - key: host
    type: 1
  - key: port
    type: 0
  - key: username
    type: 1
  - key: password
    type: 2
# List of indicator groups
metrics:
# First monitor indicator group cpu
# Note: (responseTime - response time)
  - name: cpu
    # The smaller the indicator group scheduling priority (0-127), the higher the priority. The indicator group with a lower priority will be scheduled after the collection of the indicator group with a higher priority is completed, and the indicator group with the same priority will be scheduled in parallel.
    # The indicator group with priority 0 is the availability indicator group, that is, it will be scheduled first, and other indicator groups will continue to be scheduled only after collection succeeds, and the scheduling will be interrupted if collection fails
    priority: 0
    # Specific monitoring indicators in the indicator group
    fields:
      # Indicator information includes field name type Field type :0-number number,1-string string instance Whether the instance is the primary key unit: indicator unit
      - field: hostname
        type: 1
        instance: true
      - field: usage
        type: 0
        unit: '%'
      - field: cores
        type: 0
      - field: waitTime
        type: 0
        unit: s
# (not required) Monitor indicator alias, which maps to the indicator name above. The field used to collect interface data is not directly the final indicator name, and this alias is required for mapping conversion
    aliasFields:
      - hostname
      - core1
      - core2
      - usage
      - allTime
      - runningTime
# (not required) indicator evaluation expression, which works with the aliases above to calculate the final required indicator value
# eg: cores=core1+core2, usage=usage, waitTime=allTime-runningTime
    calculates:
      - hostname=hostname
      - cores=core1+core2
      - usage=usage
      - waitTime=allTime-runningTime
# Protocols eg: sql, ssh, http, telnet, wmi, snmp, sdk
    protocol: http
# Specific collection configuration when protocol is http
    http:
      # host: ipv4 ipv6 domain name
      host: ^_^host^_^
      # port
      port: ^_^port^_^
      # url request interface path
      url: /metrics/cpu
       GET POST PUT DELETE PATCH
      method: GET
      # Whether ssl/tls is enabled, i.e. http or https, default false
      ssl: false
      # Request header content
      headers:
        apiVersion: v1
      # Request parameters
      params:
        param1: param1
        param2: param2
      # Authentication
      authorization:
        #Authentication mode:Basic Auth, Digest Auth, Bearer Token
        type: Basic Auth
        basicAuthUsername: ^_^username^_^
        basicAuthPassword: ^_^password^_^
      # Response data parsing methods: default- system rule,jsonPath-jsonPath script,website- website availability indicator monitoring
      # todo xmlPath-xmlPath script,prometheus-Prometheus data rules
      parseType: jsonPath
      parseScript: '$'

  - name: memory
    priority: 1
    fields:
      - field: hostname
        type: 1
        instance: true
      - field: total
        type: 0
        unit: kb
      - field: usage
        type: 0
        unit: '%'
      - field: speed
        type: 0
    protocol: http
    http:
      host: ^_^host^_^
      port: ^_^port^_^
      url: /metrics/memory
      method: GET
      headers:
        apiVersion: v1
      params:
        param1: param1
        param2: param2
      authorization:
        type: Basic Auth
        basicAuthUsername: ^_^username^_^
        basicAuthPassword: ^_^password^_^
      parseType: default