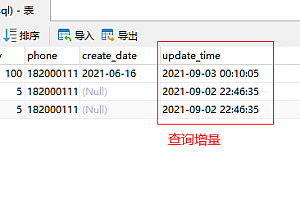
This issue recommends a library of Medium Vue large screen data presentation components——DataV。

DataV is a Vue based data visualization component library, mainly used for large-screen data display, providing SVG border and decoration, charts, water level charts, flight charts and other components, simple to use, long-term update. The React version has been released.
install and use
npm install
$ npm install @jiaminghi/data-viewuse
// All components are automatically registered as global components
import dataV from '@jiaminghi/data-view'

Vue.use(dataV)
On-demand introduction
Importing on Demand Only tree shaking based on ES module is supported. The following is an example of importing on demand:
import { borderBox1 } from '@jiaminghi/data-view'

Vue.use(borderBox1)
module
Full screen container
The data visualization page is generally displayed in a full-screen browser, and the full-screen container will automatically scale according to the screen scale and the current browser window size. After the browser is full screen, the full screen container will fill the screen.
<dv-full-screen-container>content</dv-full-screen-container>Loading to load
When data is not loaded, the Loading effect can be displayed to enhance the user experience.

<dv-loading>Loading...</dv-loading>frame
Borders are drawn by SVG elements, light weight without distortion, extremely easy to use.
- dv-border-Box-1

<dv-border-box-1>dv-border-box-1</dv-border-box-1>- dv-border-box-11

<dv-border-box-11 title="dv-border-box-11">dv-border-box-11</dv-border-box-11>decorate
You can use decorations to embellish your page to enhance the visual effect, and like the border components, they are also drawn with SVG elements.
- dv-decoration-9

<dv-decoration-9 style="width:150px;height:150px;">66%</dv-decoration-9>- dv-decoration-12

<dv-decoration-12 style="width:150px;height:150px;" />Dynamic loop graph
Basic example

<dv-active-ring-chart :config="config" style="width:200px;height:200px" />Capsule column

<dv-capsule-chart :config="config" style="width:300px;height:200px" />Flight diagram
Set a center point, several fly line points, you can get a dynamic flight diagram, the component provides dev mode can help you quickly configure the fly line point position.

<dv-flyline-chart :config="config" style="width:100%;height:100%;" />Enhanced flight chart

Ranking rotation table

<dv-scroll-ranking-board :config="config" style="width:500px;height:300px" />Demo example
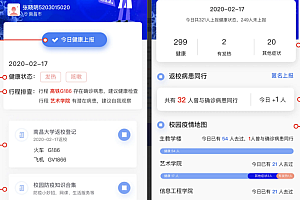
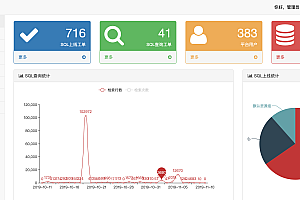
- Construction and maintenance comprehensive data

- Mechanical and electrical operation and maintenance management desk

- Electronic archives of electromechanical equipment

You can read more on your own.