This issue recommends a WebGL-based open source large-scale geospatial data visual analysis development framework – L7.
L7 is an open source WebGL-based visual analysis development framework for large-scale geospatial data launched by AntV data visualization team of Ant Financial. The L in L7 represents Location, and the 7 represents the seven continents of the world, implying the ability to provide visual analysis of global location data. L7 focuses on the visualization of data expression, and realizes clear and effective expression from data to information through the setting of visual variables such as color, size, texture, direction and volume.
L7 can meet the common map chart, BI system visual analysis, as well as GIS, transportation, power, land, agriculture, urban and other fields of spatial information management, analysis and other application system development needs.
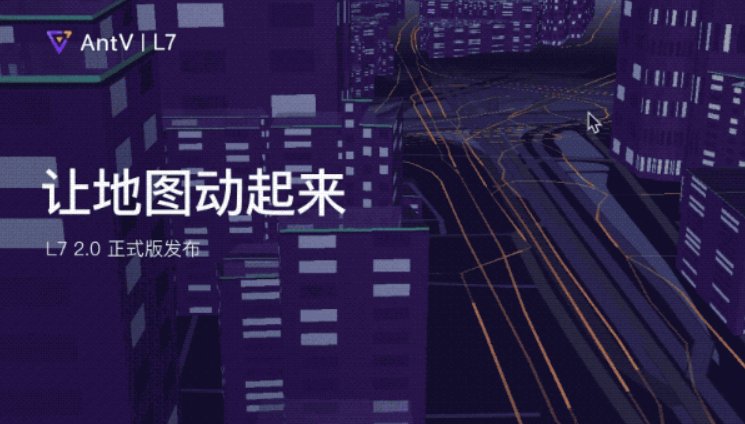
L7 features:
Data-driven visualization: Data-driven, flexible data mapping, from number to shape, support rich map visualization types, better insight into data.
2D, 3D integration of mass data high-performance rendering: mass spatial data real-time, interactive, dynamic rendering,
Simple and flexible data access: Supports CSV, JSON, GeoJSON and other data formats, and can customize data formats according to requirements, without complex spatial data conversion.
Multi-map base map support, support offline Intranet deployment: mask the differences between different base maps, users only need to pay attention to the data layer expression and interaction. Amap’s domestic legal and compliant geographic base map, Mapbox meets the needs of international business.
How to use:
Install
npm install @antv/l7@betainitialize
import { Scene } from '@antv/l7';import { Mapbox } from '@antv/l7-maps';const scene = new Scene({id: 'map',map: new Mapbox({style: 'light',pitch: 0,center: [107.054293, 35.246265],zoom: 4.056,}),});Add layer
import { PointLayer } from '@antv/l7';const pointLayer = new PointLayer().source(data).shape('circle').size('mag', [1, 25]).color('mag', ['#5B8FF9', '#5CCEA1']).style({opacity: 0.3,strokeWidth: 1,});scene.addLayer(pointLayer);Sample chart:
Path mapping
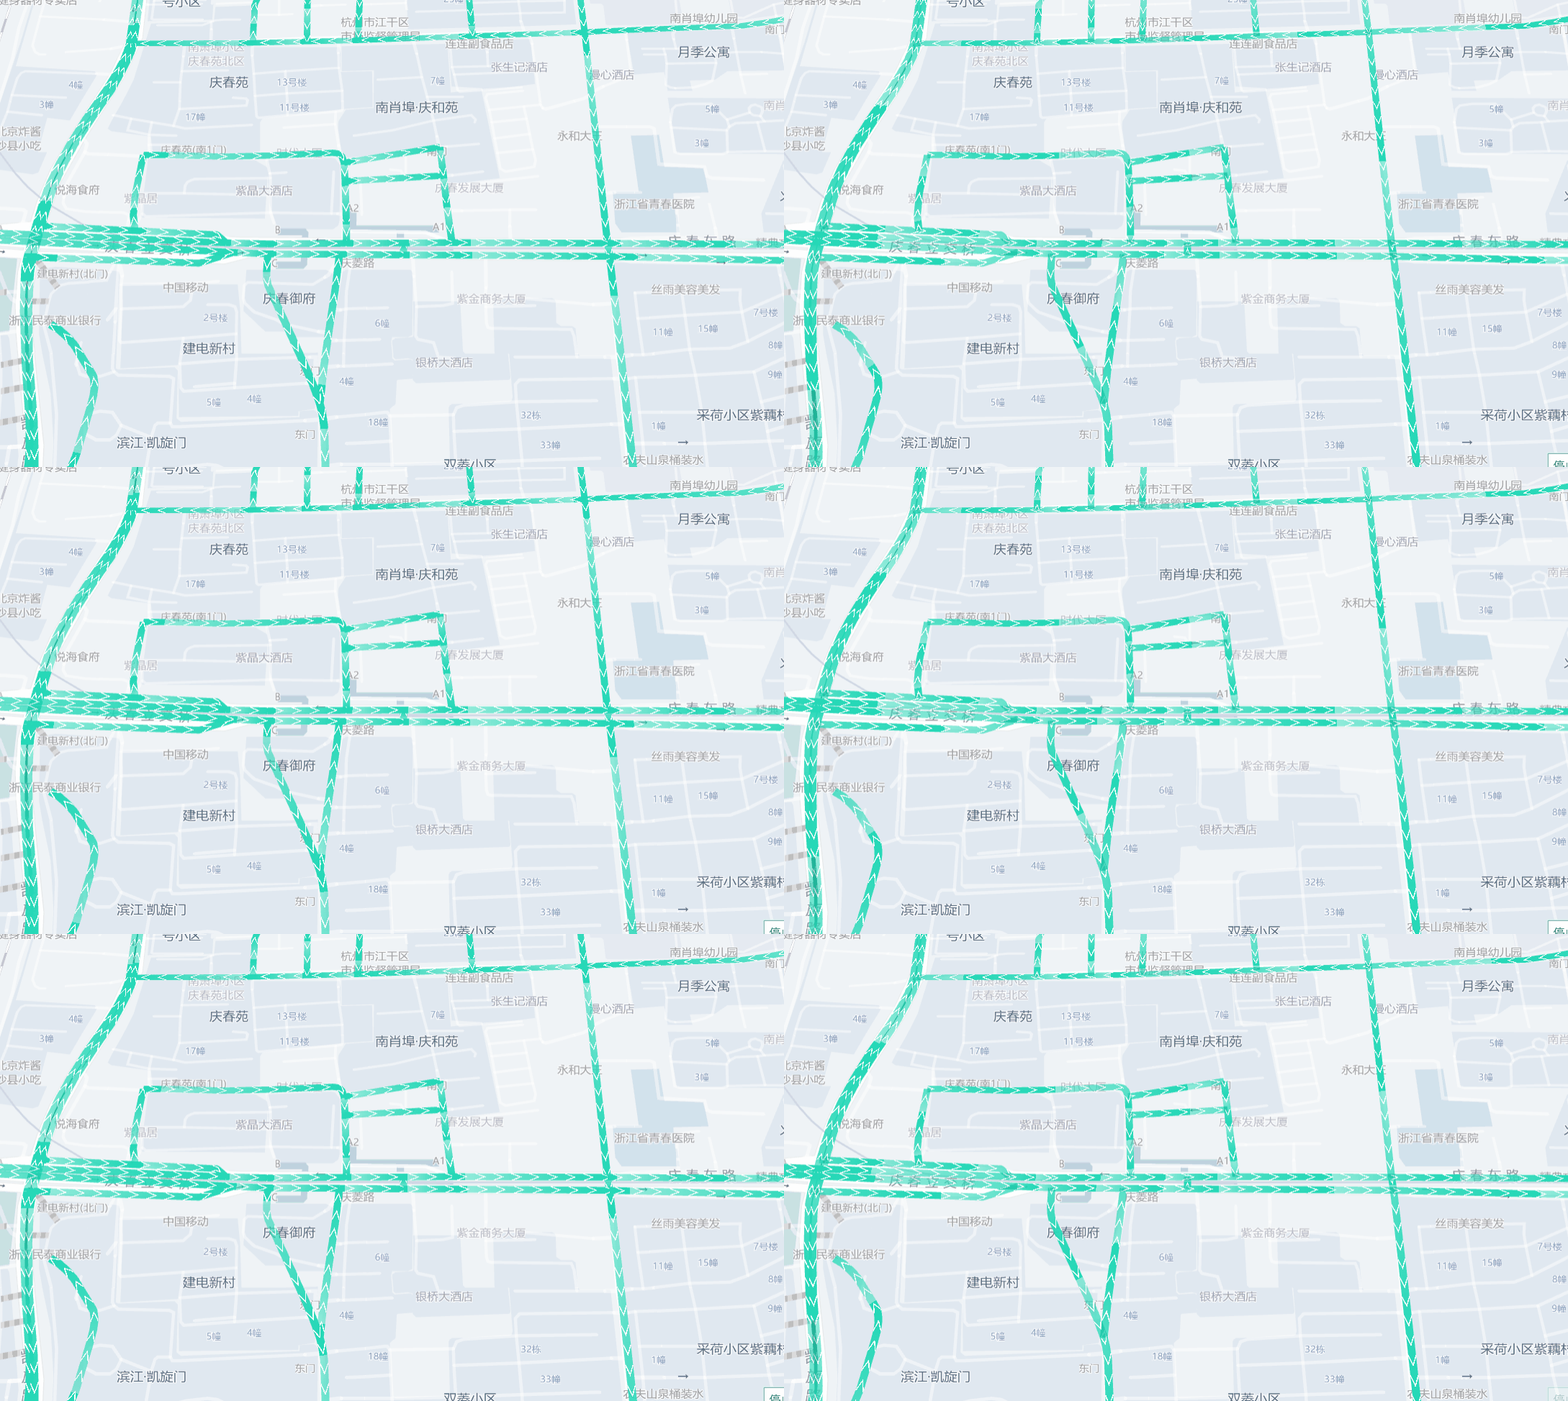
- path animation
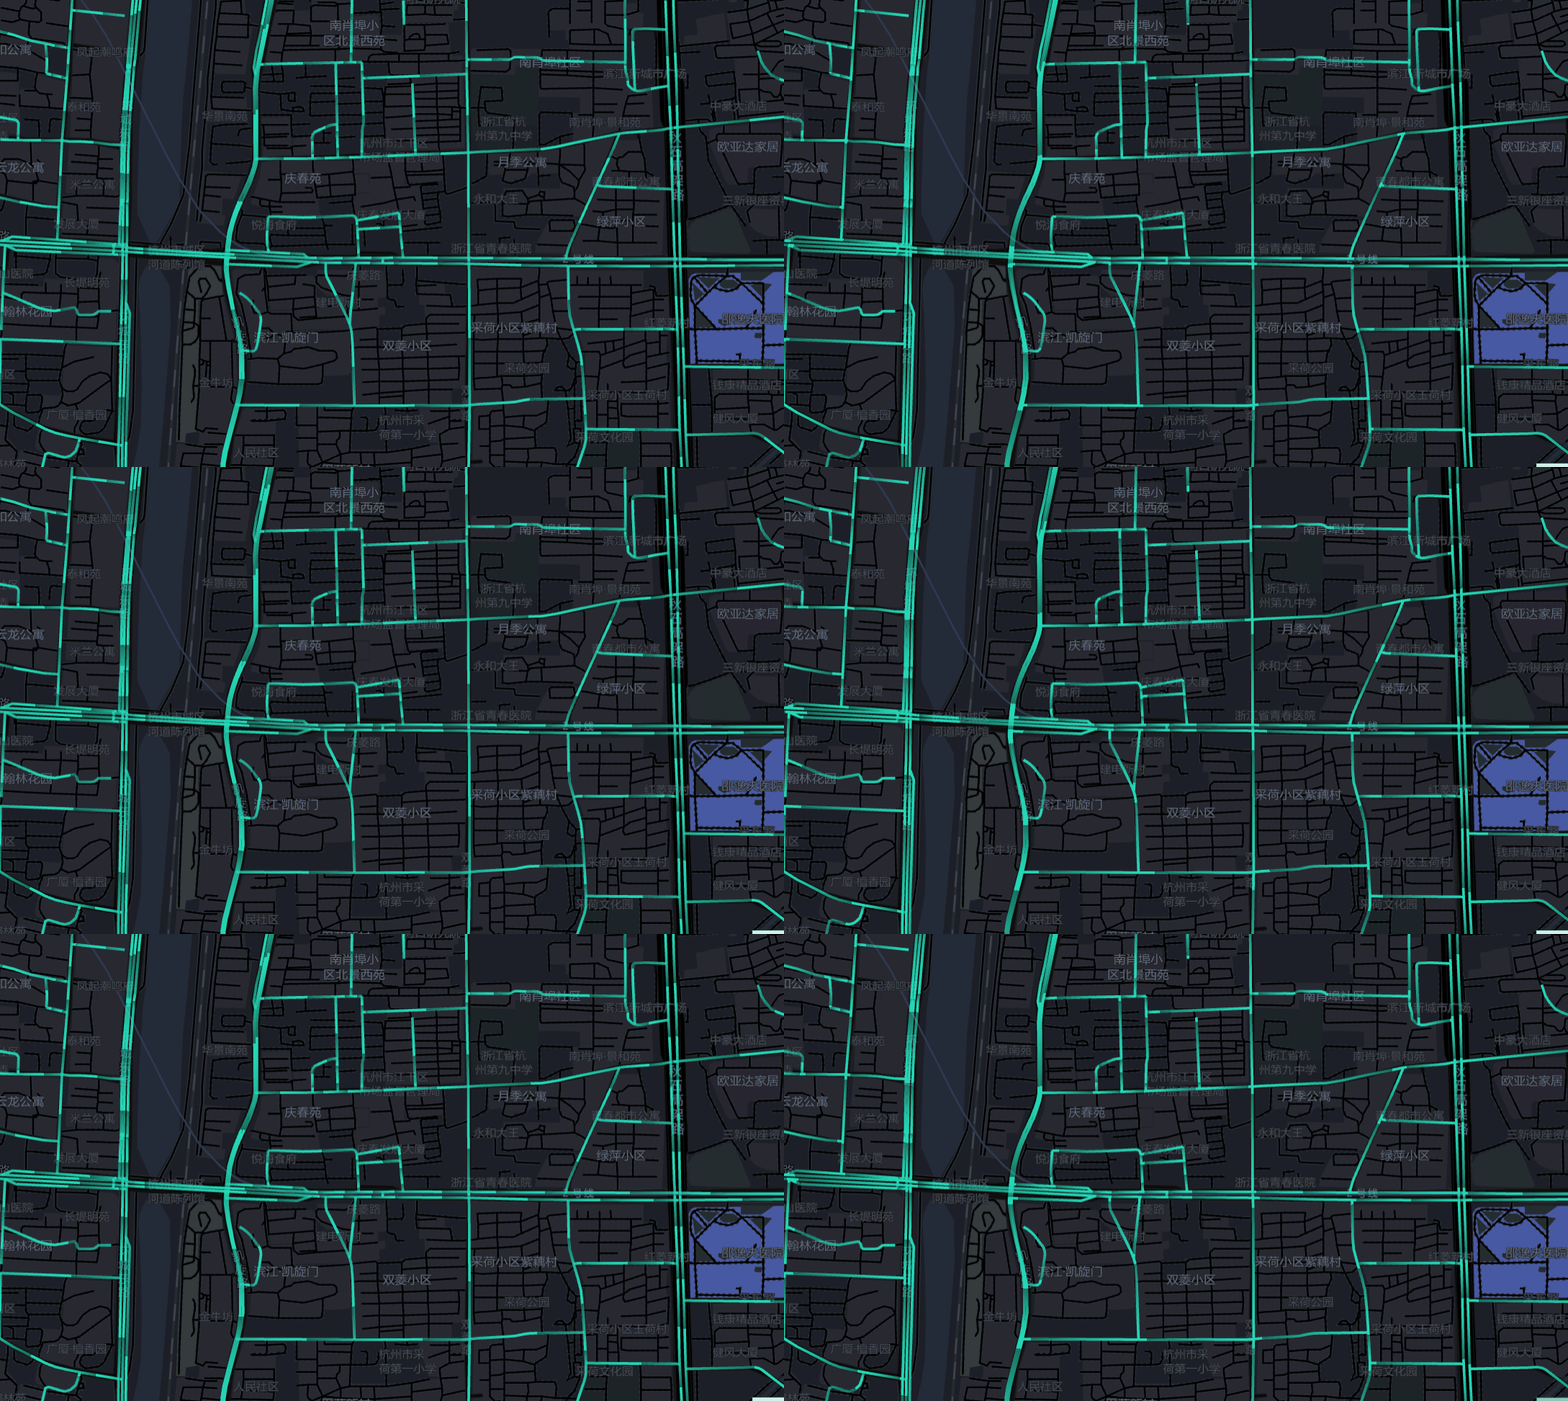
- flow diagram
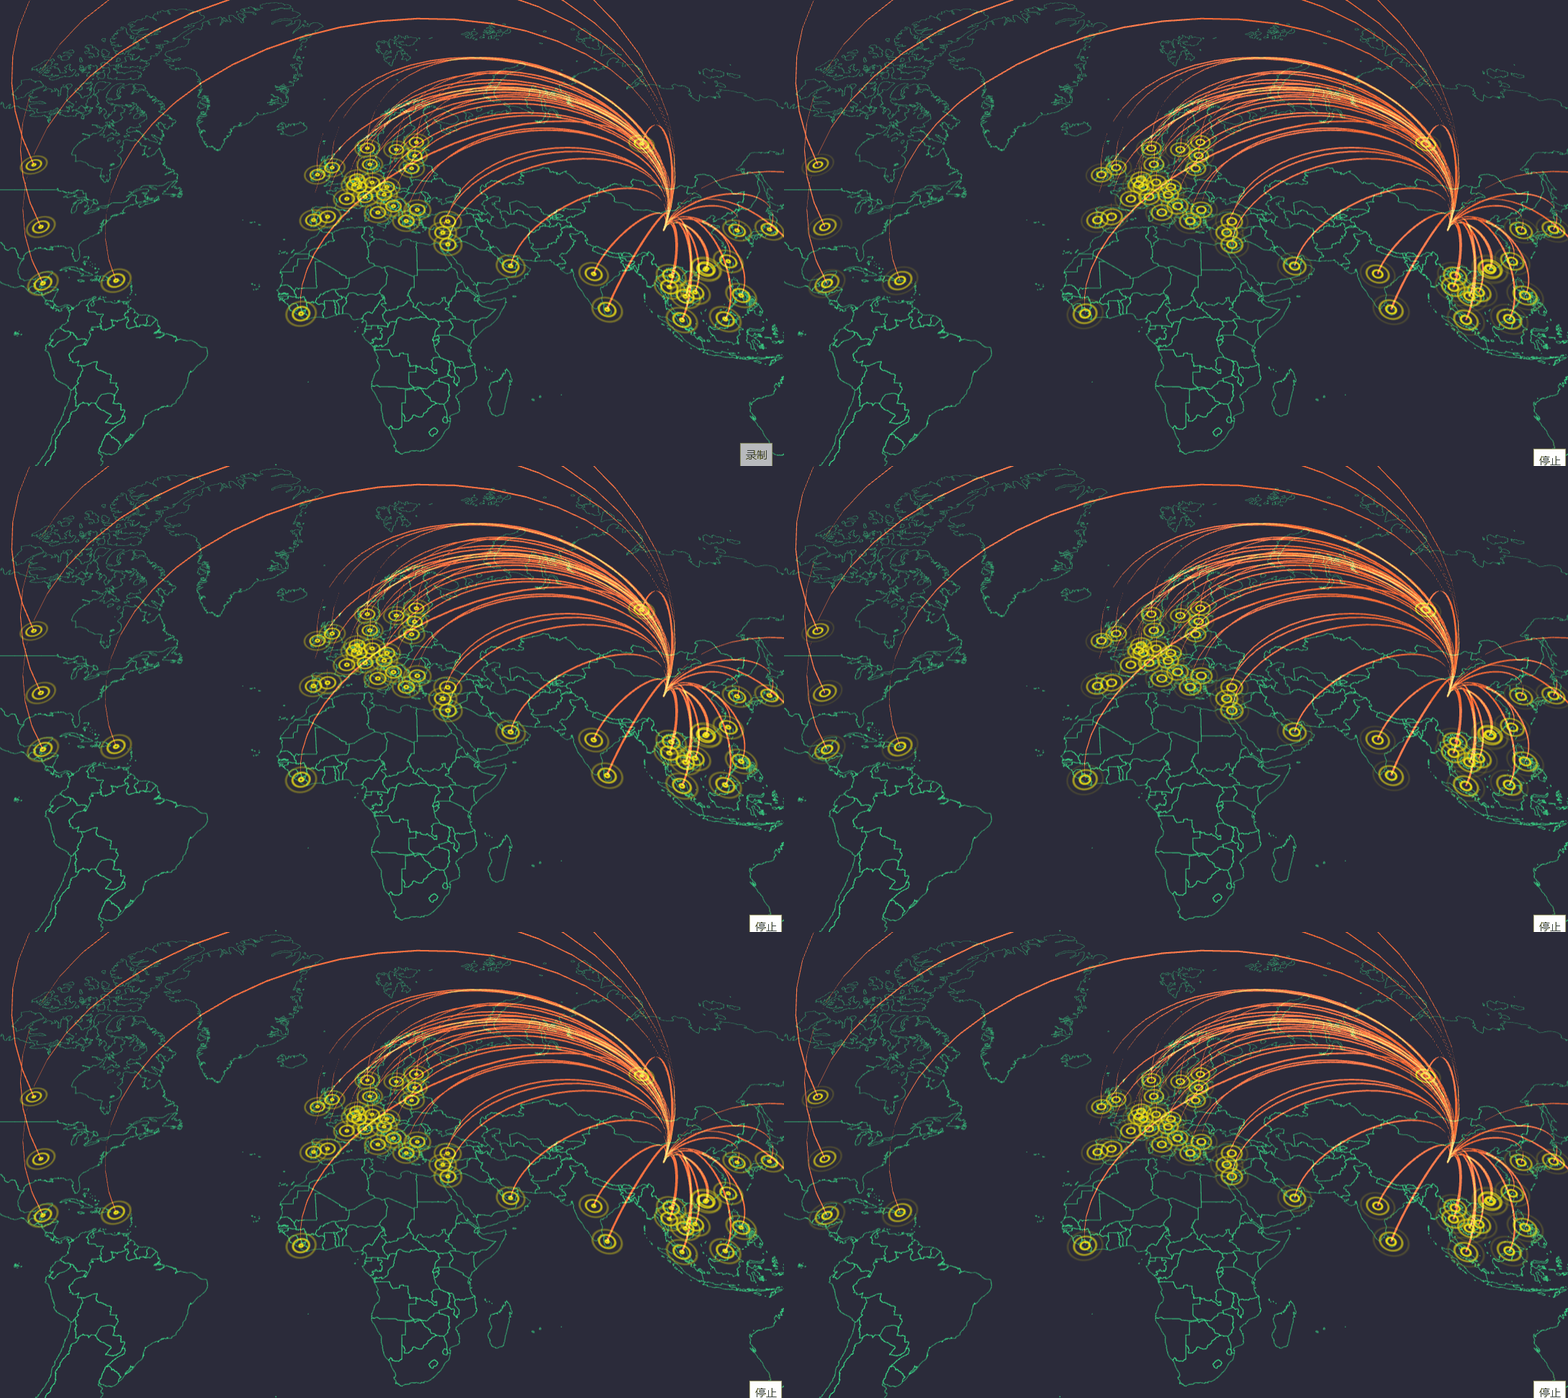
- Course chart
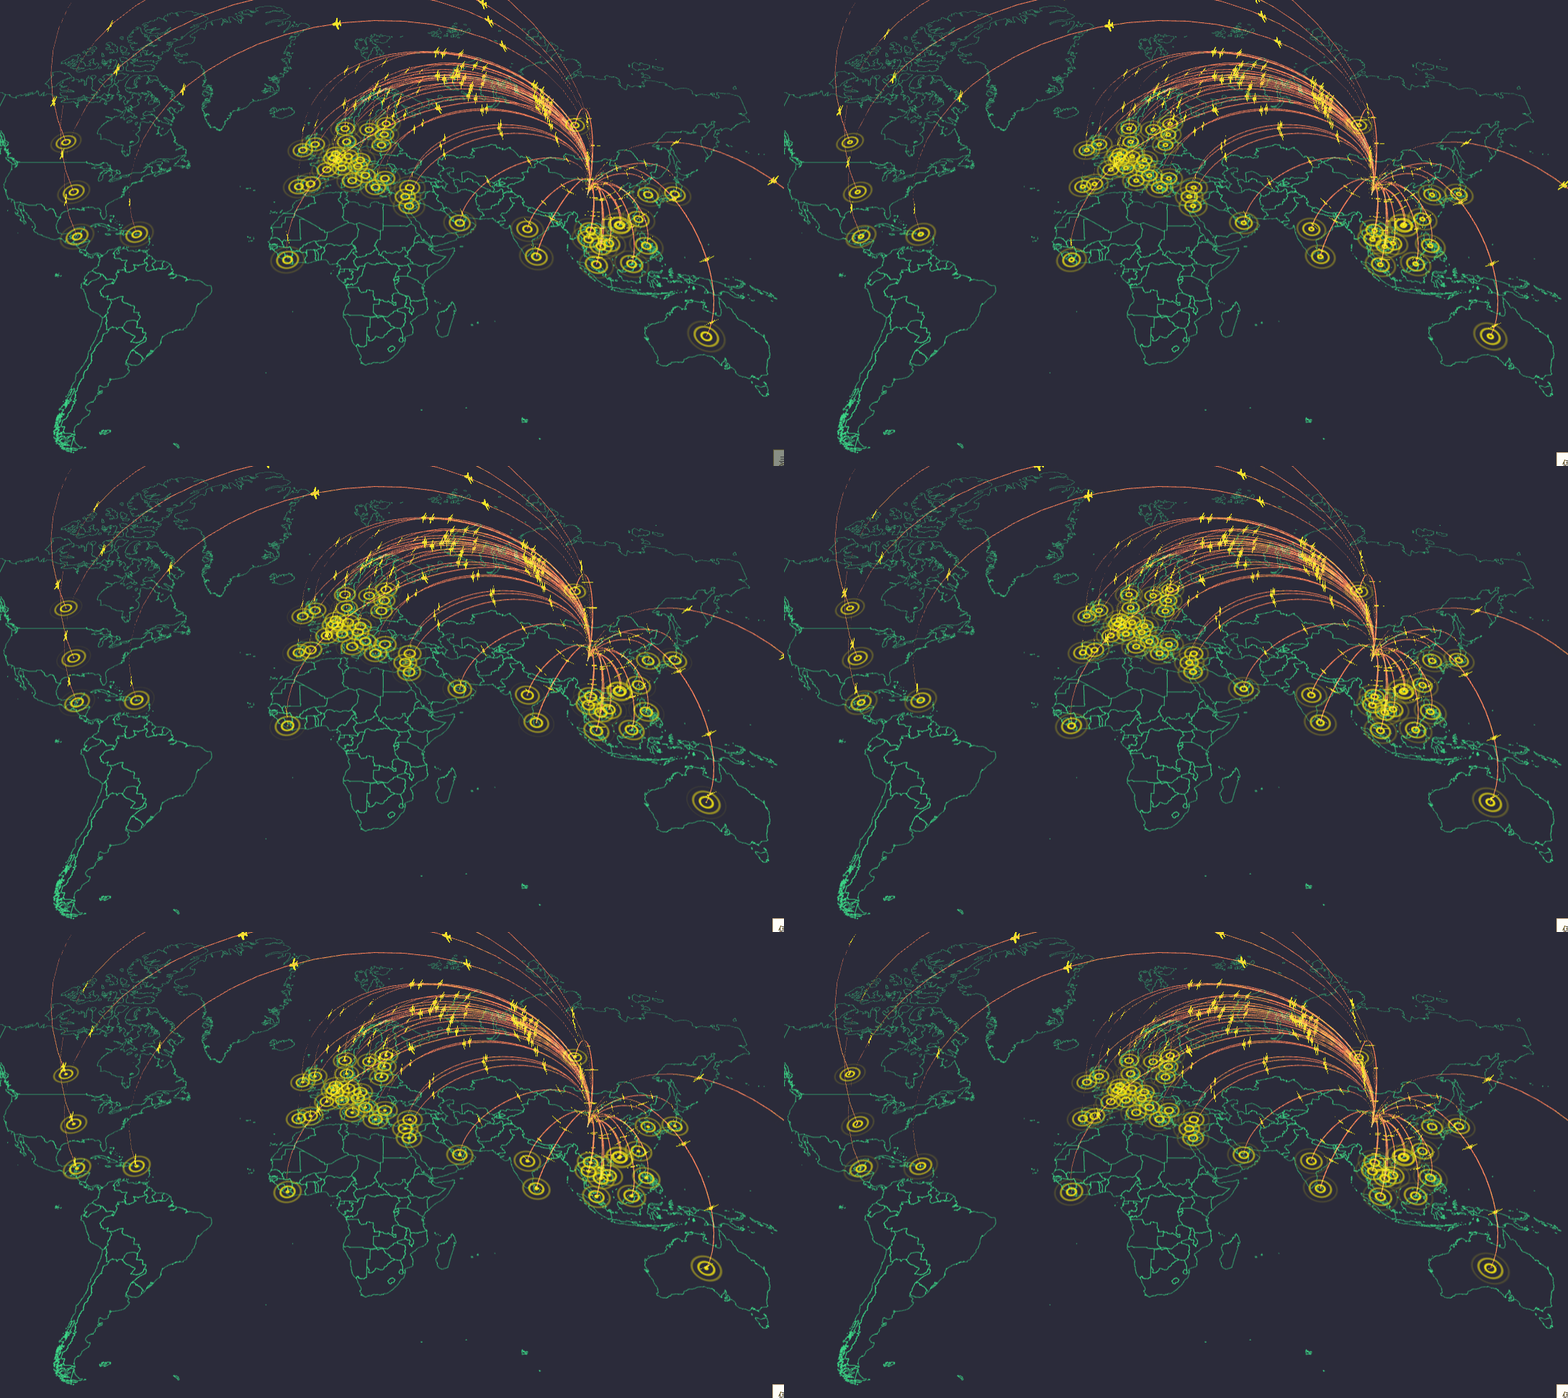
- Course chart
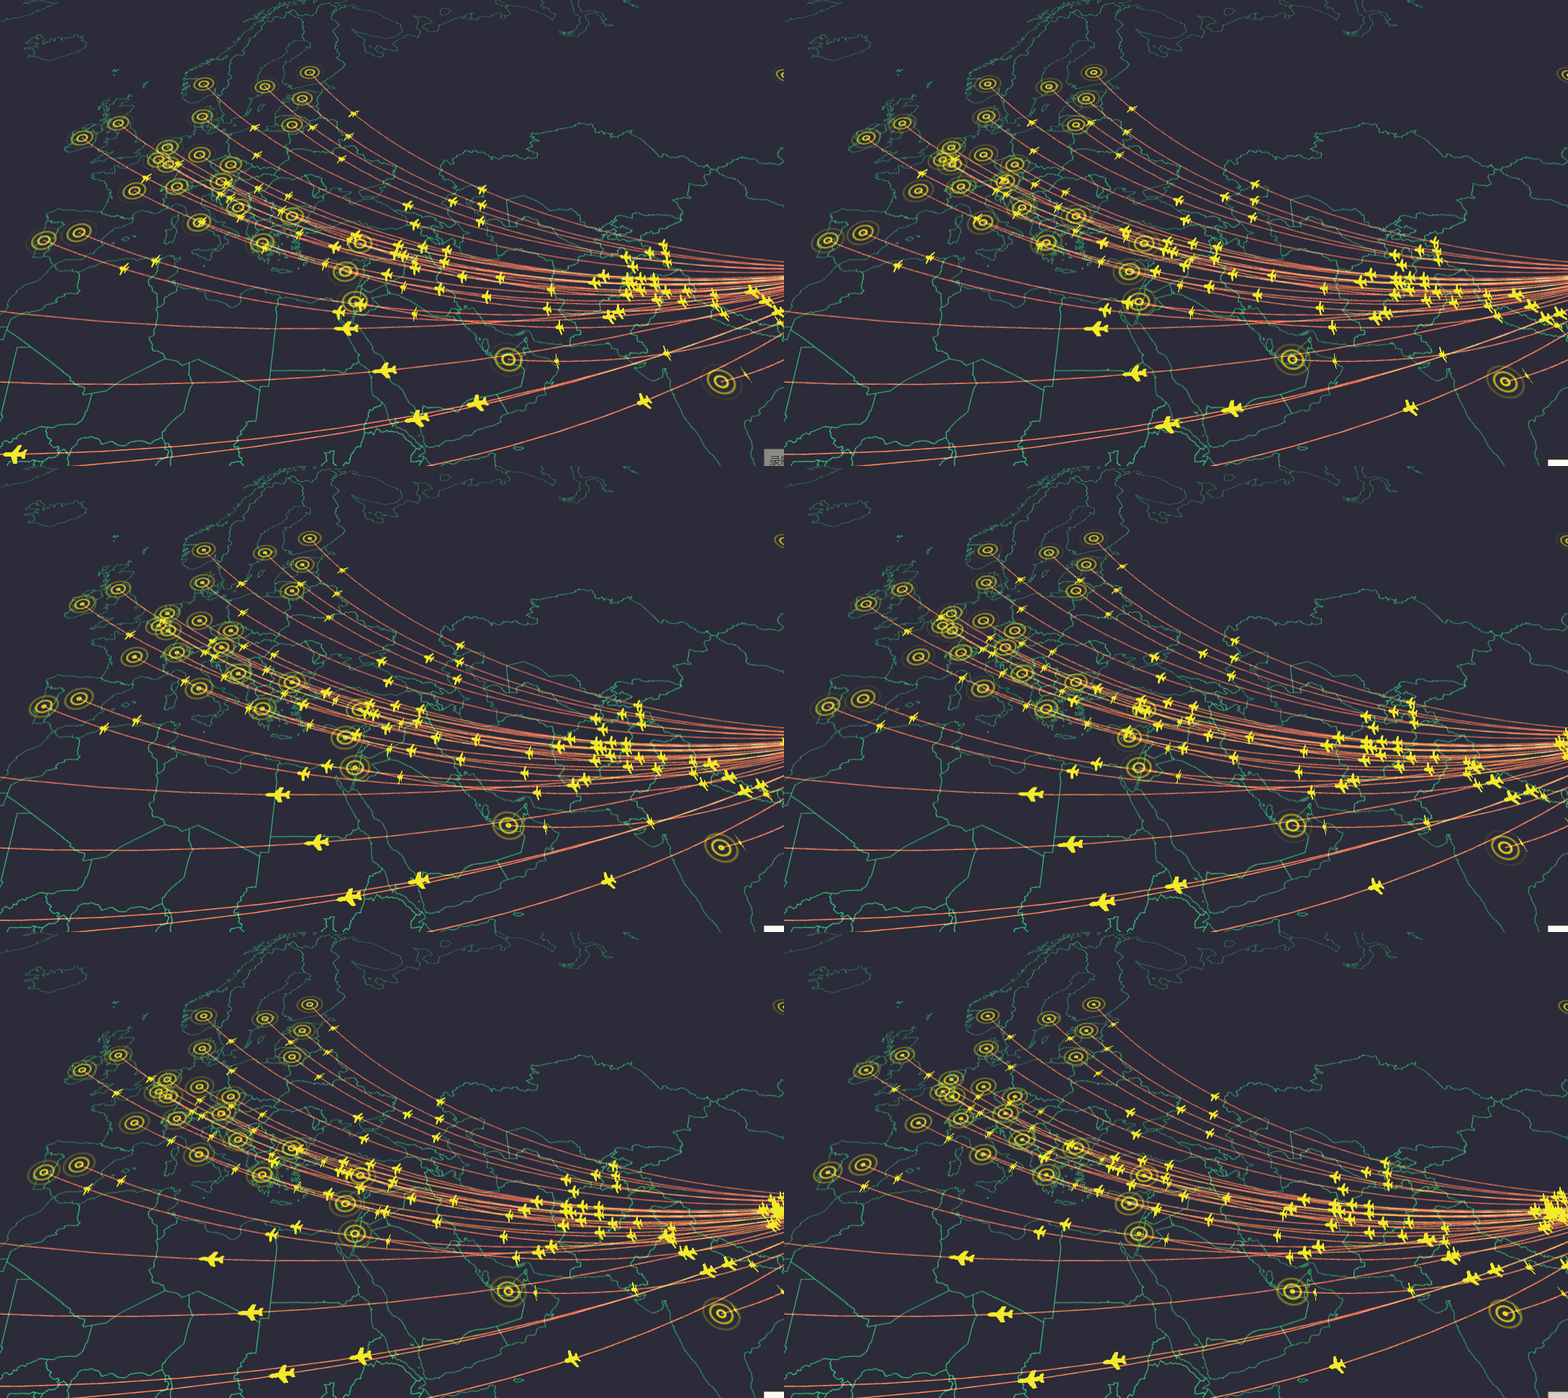
- Light up the city
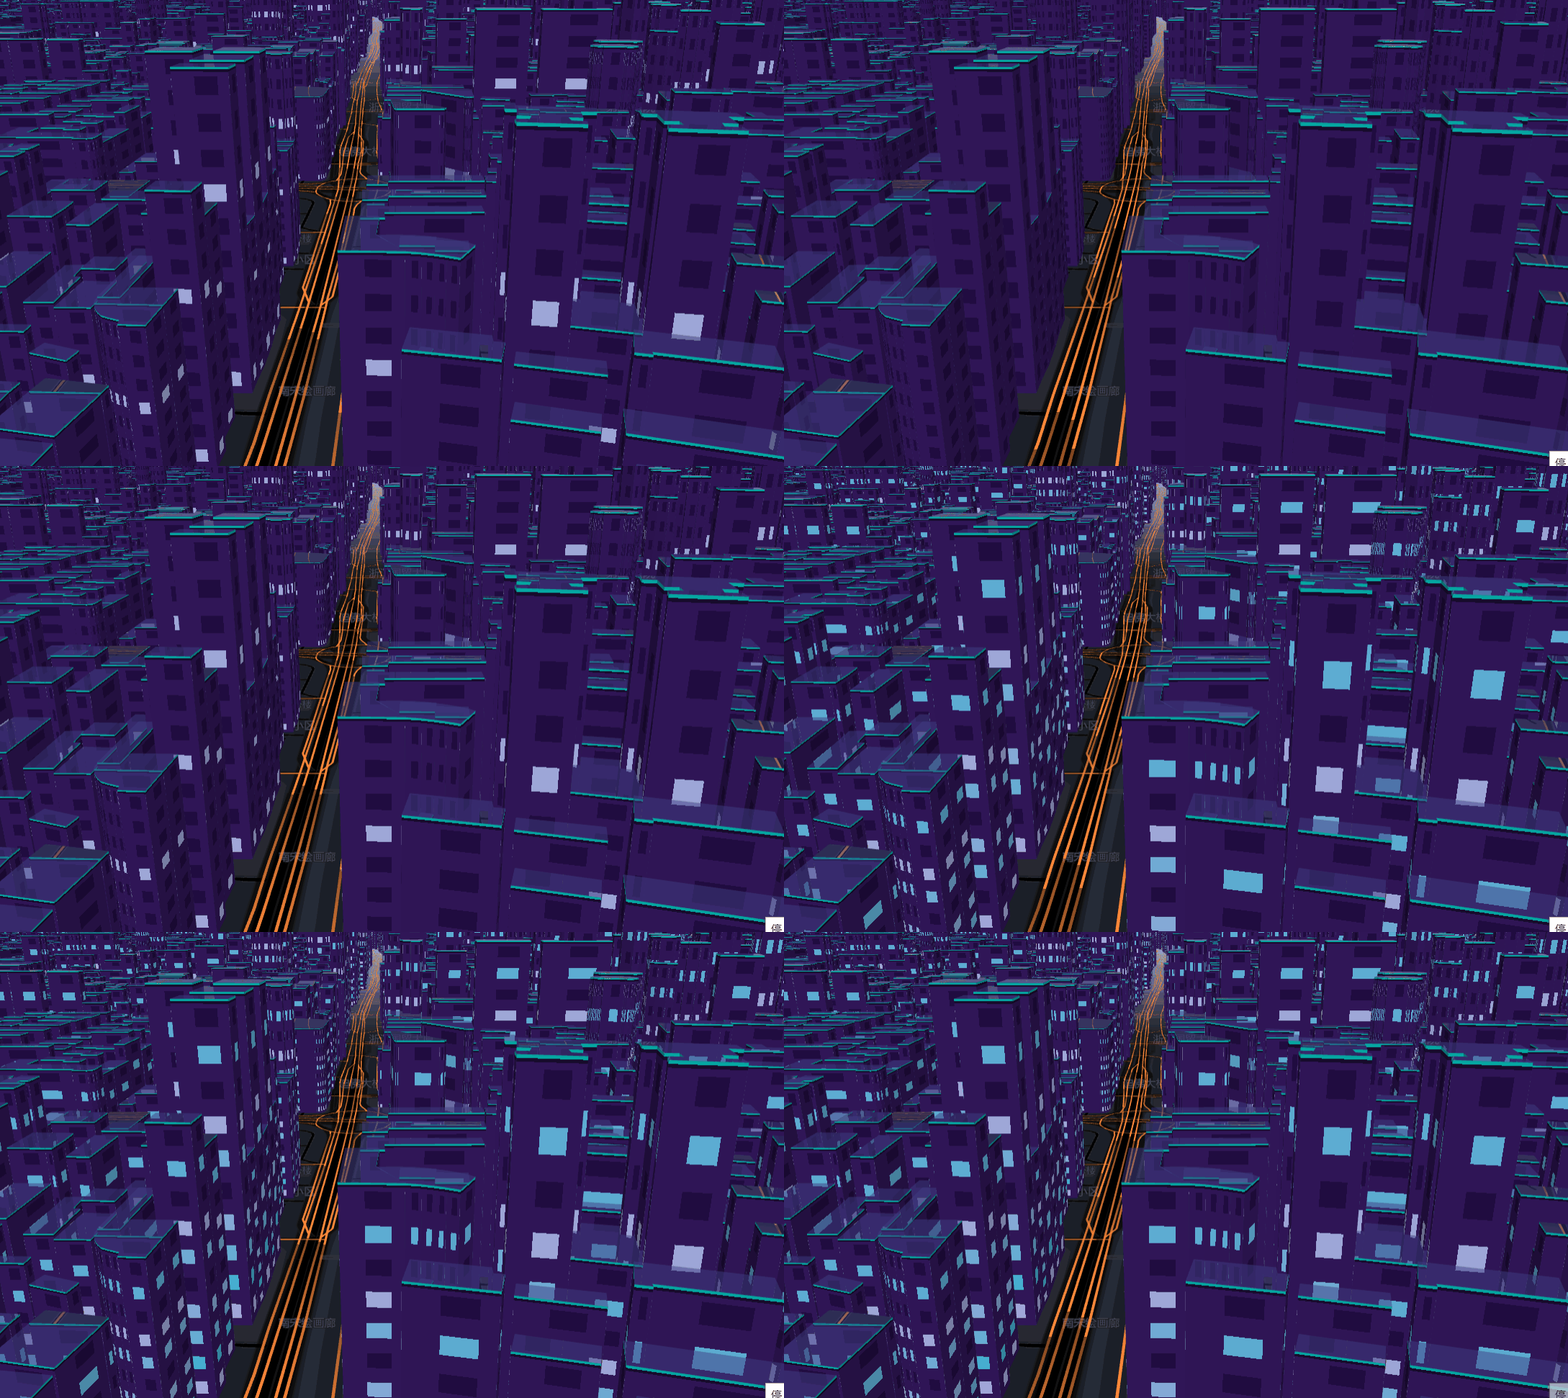
- Trajectory animation

- Basic visualization
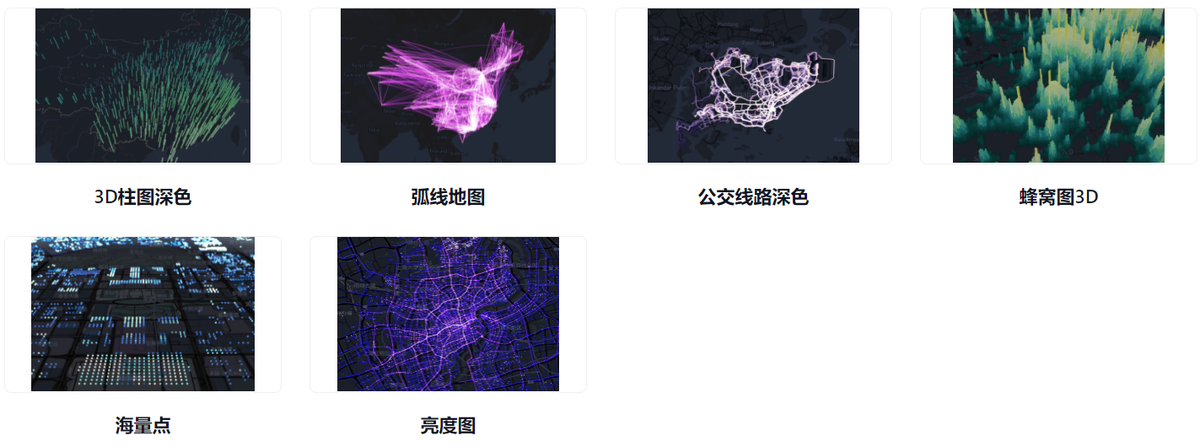
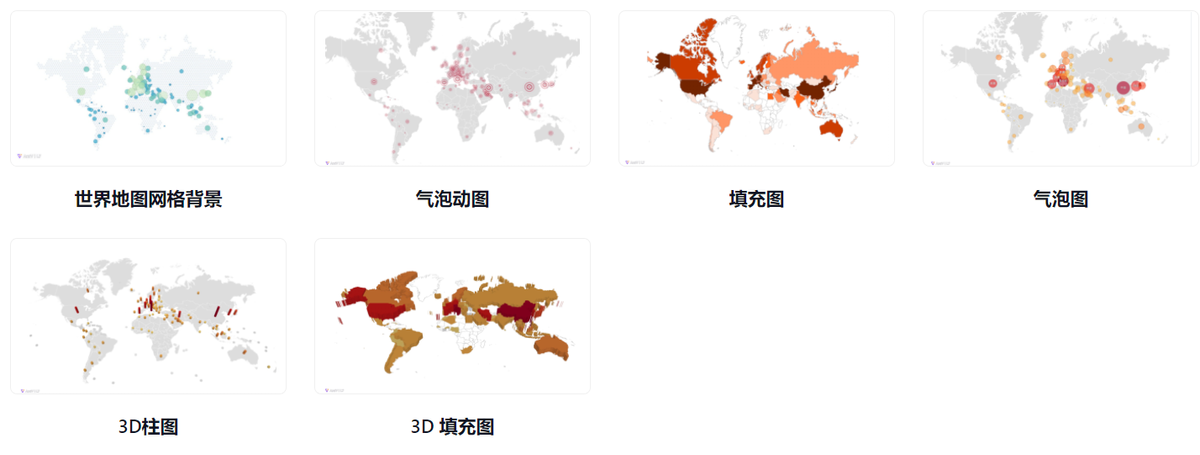
- map
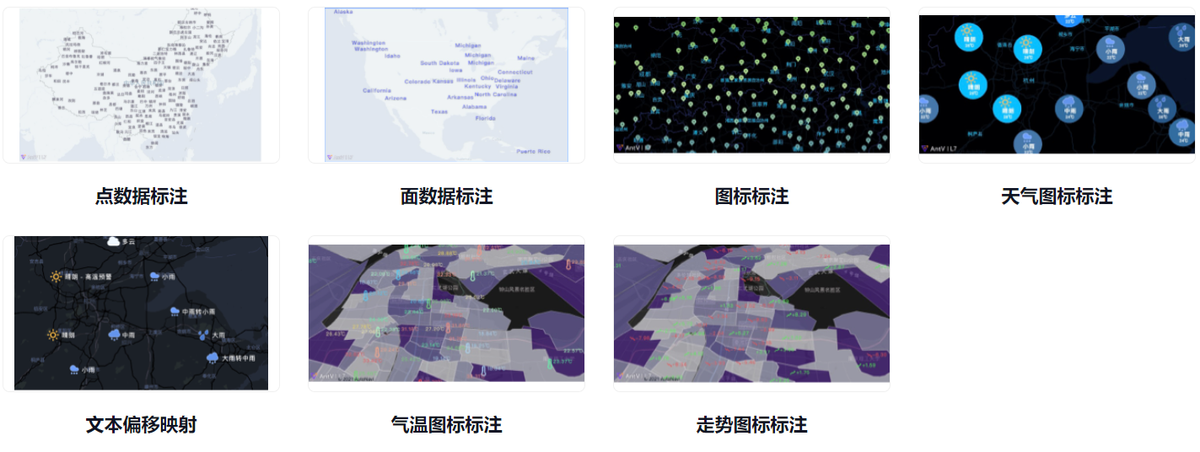
- text label
Read more on your own.


