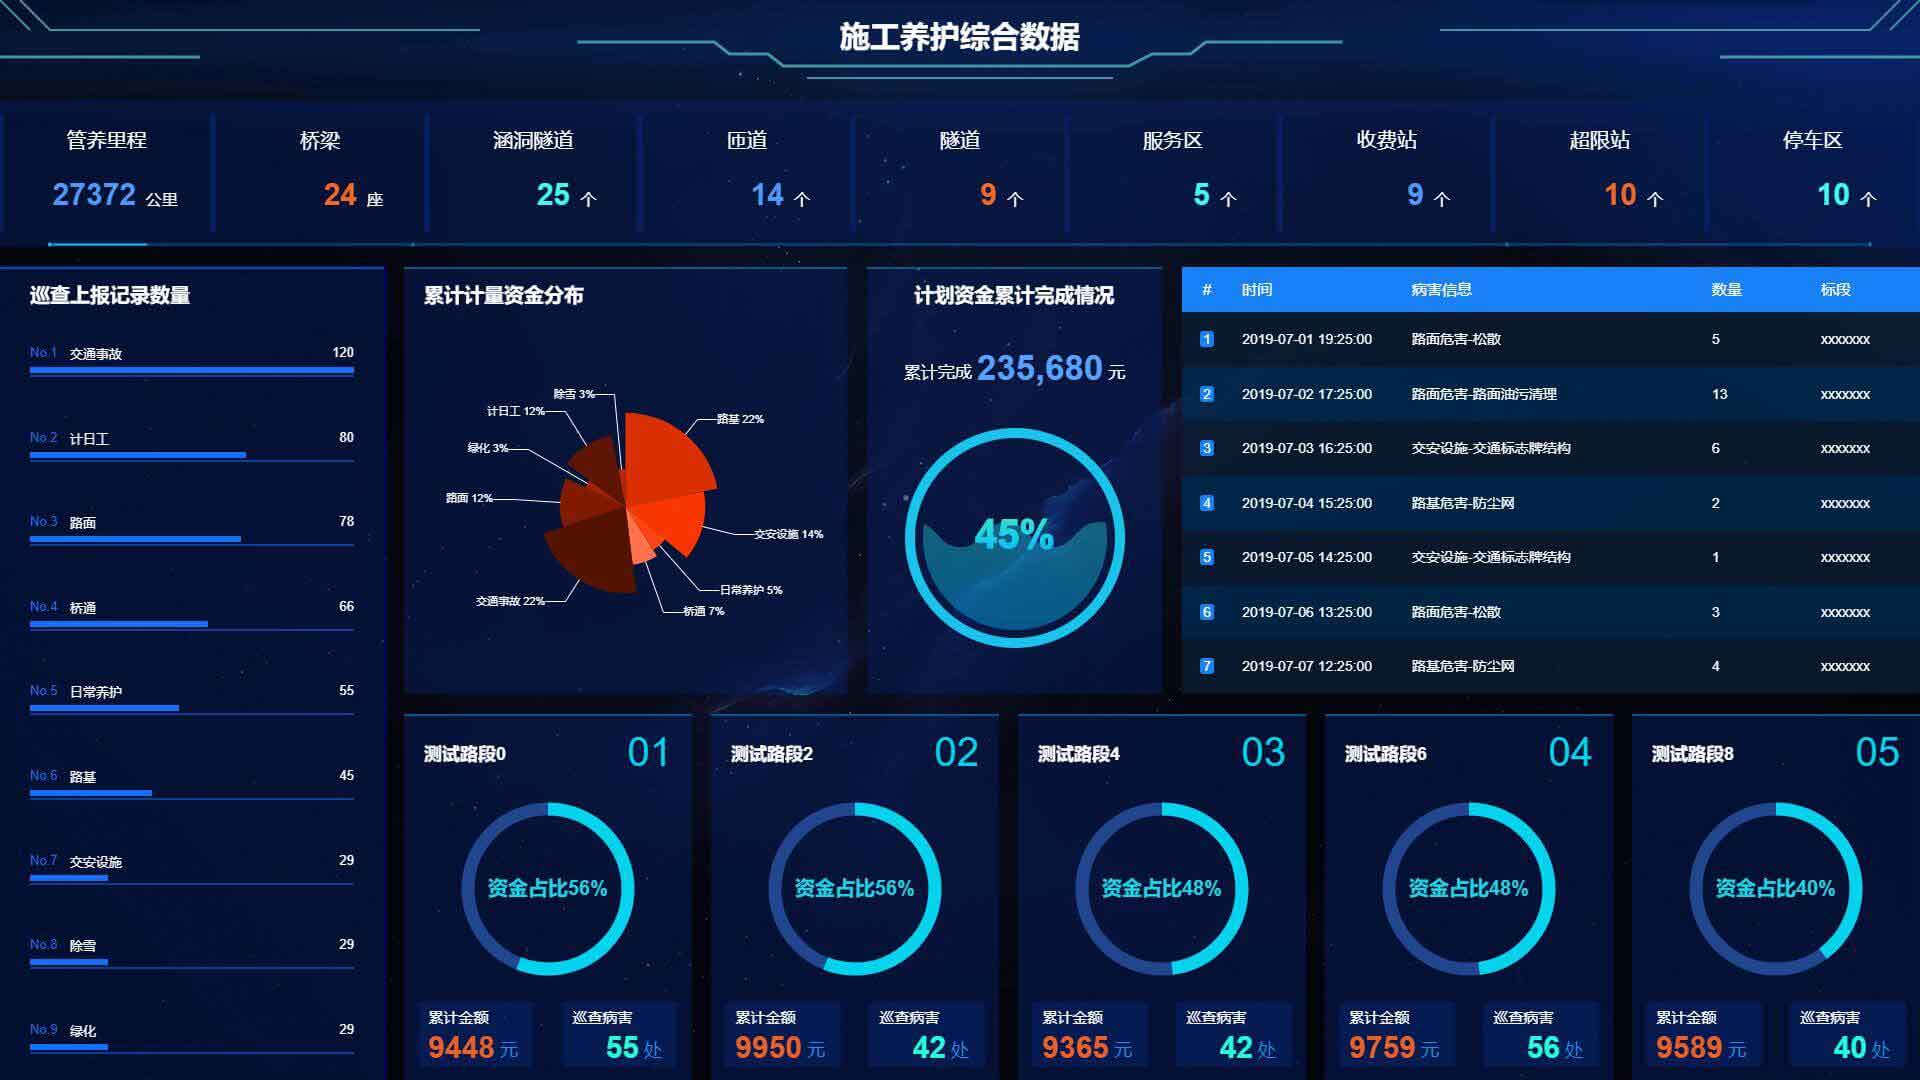
This issue recommends the Vue data visualization component library (similar to Ali DataV, large screen data display), which provides SVG border and decoration, charts, water level charts, flight charts and other components, simple to use, long-term update (React version has been released).

DataV Introduction
- DataV is a VUe-based data visualization component library (including the React version)
Provides SVG borders and decorations to enhance the visual appearance of the page
Provide common charts such as line charts
Other components, such as flight chart/wheel casting table
Npm Install Elementui S
$ npm install @jiaminghi/data-viewuse
import Vue from 'vue'import DataV from '@jiaminghi/data-view'Vue.use(DataV)// On-demand introductionimport { borderBox1 } from '@jiaminghi/data-view'Vue.use(borderBox1)Must see before use
compatibility
The component library is developed and debugged using Chrome, and there is no time or effort to do compatibility with other browsers, especially IE. So please use Chrome.
Width-height anomaly
The default width and height of components are 100%, which can be adapted according to the width and height of the parent container, but in some cases the component width and height may be abnormal. This situation is generally because the width and height of the parent container of the component has changed, and the component has not detected the change. You can bind the key value to the component. After changing the parent container width and height and redrawing the page (using $nextTick), update the key value to force the component to refresh to get the correct width and height.
frame
The borders are drawn by SVG elements, lightweight and undistorted, and they are extremely easy to use.
In-border layout
The default width and height of the border component are 100%. The nodes inside the border component are distributed by slot slots to containers whose class is border-box-content under the border component. If layout is required, arrange the layout according to the container to avoid style conflicts and abnormal display of the border.
Matters needing attention
It is recommended to encapsulate the nodes in the border into components and place them in the border as components. This is because slot’s rendering mechanism is special, and if you want to perform state-sensitive operations on the page rendering node placed in the border after the component is mounted (get DOM width and height, instantiate echarts charts, etc.), unexpected results may occur. For example, the obtained DOM width and height are 0, which can be avoided after encapsulation into components.
Example:
<dv-border-box-1>dv-border-box-1</dv-border-box-1>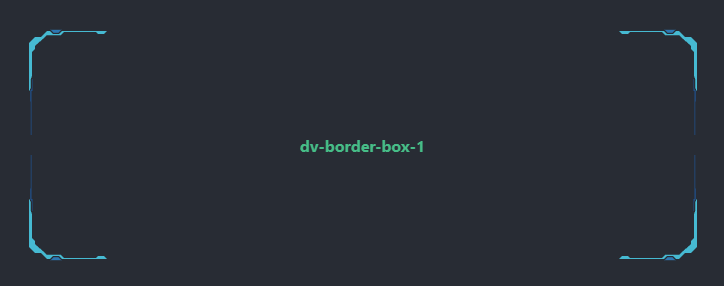
dv-border-Box-1
Enhanced version of the flight chart
After configuring several fly points, you can set the fly line between any two points to get a dynamic flight map. The dev mode provided by the component can help you quickly configure the fly point position.
<dv-flyline-chart-enhanced :config="config" style="width:100%;height:100%;" />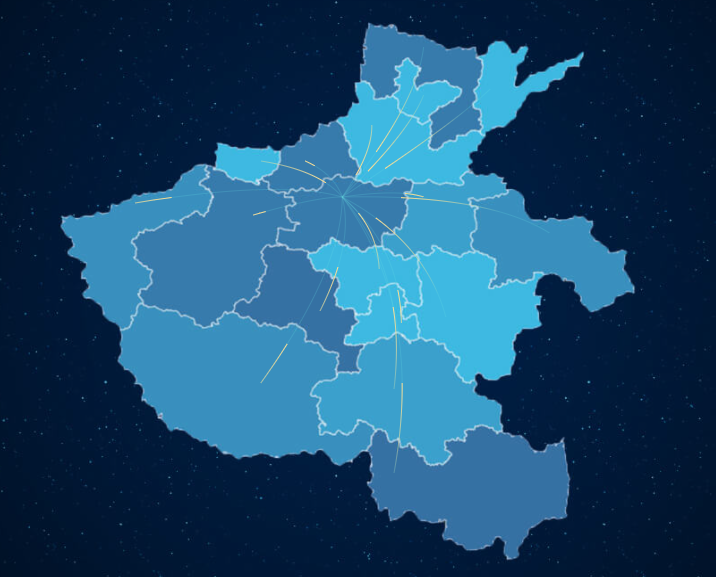
UMD edition
The UMD version can be imported directly using the script tag. The UMD version file is located in the dist directory of the project, and all components will be automatically registered as Vue global components after importing. Please ensure that Vue has been imported before importing DataV。
Construction and maintenance comprehensive data


