The recommended koTime in this issue is a springboot project performance analysis tool that quickly locates performance bottlenecks by tracking method call links and corresponding runtime.
Advantages
Real-time monitoring method, statistics running time web display method call link, bottleneck visual tracking
Faults
Due to the monitoring of each method in the project, there will be a little impact on the performance level, it is recommended to use in the development phase, and shut down after the system is stable
Get Started
Introduce
into the pom.xml file
< dependency>
< groupId> cn.langpy< /groupId>
< artifactId> ko-time< /artifactId>
< version> 2.0.5< /version>
< /dependency>
Configuration
Configure
in the application.properties file
Mandatory configuration
ko-time.pointcut=execution(public * com.huoyo.. *. * (..) # To monitor the area of the section, refer to aop’s @pointcut or FAQ on the left
Optional configuration (the following configuration is generally not required)
ko-time.enable=true # Whether to enable koTime. It is enabled by default. Disable koTime
ko-time.log-enable=false # Whether to enable control output, Default false
ko-time.log-language=chinese # Console Output language (english/chinese) Default chinese
ko-time.threshold=800.0 # Time threshold, which is used for front-end display. If the time threshold is larger than the threshold, the time threshold is displayed in red, and if the time threshold is smaller than the threshold, the time threshold is displayed in green. Default 800
ko-time.context-path=http://localhost:80 v2.0.1 supports
ko-time.exception-enable=true # Whether to enable exception detection, The default value is false. After this function is enabled, statistics on exceptions thrown by methods are collected. v2.0.0 supports
ko-time.auth-enable=true # Whether to enable authentication. The default value is false. After this function is enabled, login is required to access the call link.
ko-time.user-name=xxxx # Login user
ko-time.password=xxxx # Login password v2.0.2 support
< Access
Note:
1. After introducing the above dependencies and configurations, and checking to see if there are AOP-related packages in the project, koTime uses the @Aspect annotation and imports those that are not introduced, such as aspectj or spring-boot-starter-aop
2. With the previous steps completed, koTime integration is complete and no additional configuration is required
- Start the project access /koTime path
- If you just want to count a method, add @ComputeTime to the method and the console will output time
UI Page Description
< Home panel
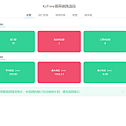
There are six statistical indicators on the home page, which are
Total number of interfaces, delayed response interfaces, normal response interfaces, average response, maximum response, minimum response
Whether the interface delay depends on the configuration of ko-time.threshold. If it is larger than the threshold, the delay is indicated in red, as shown in the figure below.

Interface list
The list shows the interfaces that have been detected and are arranged in reverse order according to their average response time. Interfaces that exceed ko-time.threshold are displayed in red, as shown in the following figure.

After clicking each interface, it will display the method call link of the interface, the running time of each method, and whether the method is abnormal. The method node can drag
.

Exception list
Exception list takes the exception as the entry point and shows where each exception occurred

Configuration panel
The configuration panel has four configurations that can be configured without restarting the system
Turn on koTime monitoring: This switch corresponds to ko-time.enable, which is enabled by default and can be turned off when koTime is not needed
Enable exception monitoring: This switch corresponds to ko-time.exception-enable, which is turned off by default and can be turned on when needed
Enable console log: This switch corresponds to ko-time.log-enable, which is off by default, and can be selected to enable when needed, you can print logs on the console
Method running time threshold: This switch corresponds to ko-time.threshold, the default is 800ms, which can be adjusted. After the adjustment, the interface list and the color of method nodes will change with the new threshold