In this episode, we recommend a Javascript based charting tool called Mermaid.

Mermaid is a Javascript based chart drawing tool, by parsing Markdown-like text syntax to achieve chart creation and dynamic modification. The primary purpose of Mermaid is to keep documentation updated as development progresses.
Mapping and documentation takes valuable development time, and it quickly expires as the business changes. But a lack of charts or documentation can be a huge impediment to productivity and business learning for new team members. Mermaid solves this problem by allowing users to create diagrams that can be easily modified, or as part of a production script (or other code).
class=”pgc-h-arrow-right” data-track=”8″> How to use
1 Use it directly in the mermaid online editor: mermai.live

2 Use the Mermaid plugin
Mermaid currently adds default plugins to GitLab, Azure Devops, Tuleap, Joplin, Notion, and can be used directly. Other platforms, such as GitHub, GitBook, WordPress, Hexo, Vs Code, etc., need to add plugins manually.
View supported platforms:
https://mermaid-js.github.io/mermaid/#/./integrations

Use
in vs code
3 Call the Mermaid Javascript API
Call through CDN Example:
<html>
    <body>
        <script src="https://cdn.jsdelivr.net/npm/mermaid/dist/mermaid.min.js"></script>
        <script>
            mermaid.initialize({ startOnLoad: true });
        </script>

        Here is one mermaid diagram:
        <div class="mermaid">
            graph TD
            A[Client] --> B[Load Balancer]
            B --> C[Server1]
            B --> D[Server2]
        </div>

        And here is another:
        <div class="mermaid">
            graph TD
            A[Client] -->|tcp_123|
            B(Load Balancer)
            B -->|tcp_456| C[Server1]
            B -->|tcp_456| D[Server2]
        </div>
    </body>
</html>
Or refer to a separate file:
<html lang="en">
    <head>
        <meta charset="utf-8" />
    </head>
    <body>
        <div class="mermaid">
            graph LR
            A --- B
            B-->C[fa:fa-ban forbidden]
            B-->D(fa:fa-spinner);
        </div>
        <div class="mermaid">
            graph TD
            A[Client] --> B[Load Balancer]
            B --> C[Server1]
            B --> D[Server2]
        </div>
        <script src="The\Path\In\Your\Package\mermaid.js"></script>
        <script>
            mermaid.initialize({ startOnLoad: true });
        </script>
    </body>
</html>
在Python 与 mermaid-js Example of integration:
import base64
from IPython.display import Image, display
import matplotlib.pyplot as plt

def mm(graph):
  graphbytes = graph.encode("ascii")
  base64_bytes = base64.b64encode(graphbytes)
  base64_string = base64_bytes.decode("ascii")
  display(Image(url="https://mermaid.ink/img/" + base64_string))

mm("""
graph LR;
    A--> B & C & D;
    B--> A & E;
    C--> A & E;
    D--> A & E;
    E--> B & C & D;
""")
4 Add Mermaid as dependency
npm:
npm install -g yarnyarn:
yarn add mermaidor
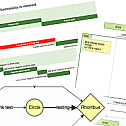
yarn add --dev mermaidclass=”pgc-h-arrow-right” data-track=”35″> Sample chart
flowchart LR
A[Hard] --> |Text| B(Round)
B -->  C{Decision}
C --> |One| D[Result 1]
C --> |Two| E[Result 2]
sequenceDiagram
Alice-> > John: Hello John, how are you?
loop Healthcheck
John-> > John: Fight against hypochondria
end
Note right of John: Rational thoughts!
John--> > Alice: Great!
John-> > Bob: How about you?
Bob--> > John: Jolly good! 
Gantt chart
gantt
    section Section
    Completed :done,    des1, 2014-01-06,2014-01-08
    Active        :active,  des2, 2014-01-07, 3d
    Parallel 1   :         des3, after des1, 1d
    Parallel 2   :         des4, after des1, 1d
    Parallel 3   :         des5, after des3, 1d
    Parallel 4   :         des6, after des4, 1d
classDiagram
Class01 <|-- AveryLongClass : Cool
<<Interface>> Class01
Class09 --> C2 : Where am i?
Class09 --* C3
Class09 --|> Class07
Class07 : equals()
Class07 : Object[] elementData
Class01 : size()
Class01 : int chimp
Class01 : int gorilla
class Class10 {
<<service>>
int id
size()
}
Class diagram
Diagram of state
stateDiagram-v2
[*] --> Still
Still --> [*]
Still --> Moving
Moving --> Still
Moving --> Crash
Crash --> [*]
Diagram of state
User experience journey diagram
  journey
    title My working day
    section Go to work
      Make tea: 5: Me
      Go upstairs: 3: Me
      Do work: 1: Me, Cat
    section Go home
      Go downstairs: 5: Me
      Sit down: 3: Me
User experience journey diagram
—END—
Open source protocol:MIT