The Diagrams recommended in this issue are a cloud system architecture prototype drawing library.

Diagrams let you draw cloud system architectures in Python code, and were born to prototype new system architectures without any design tools. You can also describe or visualize existing system architectures, and Diagram as Code allows you to track architecture diagram changes in any version control system. This approach is more in line with what we programmers are used to than dragging and adjusting ICONS on the UI.
class=”pgc-h-arrow-right” data-track=”6″> Install
It requires Python 3.6 or later, please check your Python version first.
It uses Graphviz to render the chart, so you need to install Graphviz to use the chart. After you have installed graphviz (or already installed), install the chart.
brew install graphviz If you are using Homebrew, macOS users can download Graphviz in the following ways. Similarly, Windows users who have Chocolatey installed can run choco install graphviz.
# using pip (pip3)
$ pip install diagrams

# using pipenv
$ pipenv install diagrams

# using poetry
$ poetry add diagrams
# diagram.py
from diagrams import Diagram
from diagrams.aws.compute import EC2
from diagrams.aws.database import RDS
from diagrams.aws.network import ELB
with Diagram("Web Service", show=False):
ELB("lb") >> EC2("web") >> RDS("userdb")This code generates the following figure :
$ python diagram.py
class=”pgc-h-arrow-right” data-track=”16″> Example
Group worker on AWS
from diagrams import Diagram
from diagrams.aws.compute import EC2
from diagrams.aws.database import RDS
from diagrams.aws.network import ELB

with Diagram("Grouped Workers", show=False, direction="TB"):
    ELB("lb") >> [EC2("worker1"),
                  EC2("worker2"),
                  EC2("worker3"),
                  EC2("worker4"),
                  EC2("worker5")] >> RDS("events")
Clustered Web service
from diagrams import Cluster, Diagram
from diagrams.aws.compute import ECS
from diagrams.aws.database import ElastiCache, RDS
from diagrams.aws.network import ELB
from diagrams.aws.network import Route53

with Diagram("Clustered Web Services", show=False):
    dns = Route53("dns")
    lb = ELB("lb")

    with Cluster("Services"):
        svc_group = [ECS("web1"),
                     ECS("web2"),
                     ECS("web3")]

    with Cluster("DB Cluster"):
        db_primary = RDS("userdb")
        db_primary - [RDS("userdb ro")]

    memcached = ElastiCache("memcached")

    dns >> lb >> svc_group
    svc_group >> db_primary
    svc_group >> memcached
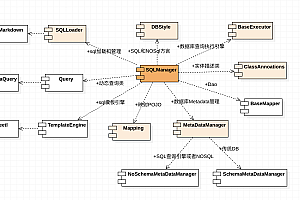
Event handling on AWS
from diagrams import Cluster, Diagram
from diagrams.aws.compute import ECS, EKS, Lambda
from diagrams.aws.database import Redshift
from diagrams.aws.integration import SQS
from diagrams.aws.storage import S3

with Diagram("Event Processing", show=False):
    source = EKS("k8s source")

    with Cluster("Event Flows"):
        with Cluster("Event Workers"):
            workers = [ECS("worker1"),
                       ECS("worker2"),
                       ECS("worker3")]

        queue = SQS("event queue")

        with Cluster("Processing"):
            handlers = [Lambda("proc1"),
                        Lambda("proc2"),
                        Lambda("proc3")]

    store = S3("events store")
    dw = Redshift("analytics")

    source >> workers >> queue >> handlers
    handlers >> store
    handlers >> dw
class=”pgc-h-arrow-right”>
The
graph represents a global graph context, which you can create using the Diagram class. The first argument to the Diagram constructor will be used to output the file name.
from diagrams import Diagram
from diagrams.aws.compute import EC2

with Diagram("Simple Diagram"):
EC2("web")
If you run the above script with the following command
$ python diagram.pyIt will generate an image file with a single EC2 node on your working directory and open the created image file immediately. simple_diagram.png
A node is an abstract concept that represents an object for a single system component. A node object consists of three parts: a provider, a resource type, and a name. You may have seen each part of the previous example
from diagrams import Diagram
from diagrams.aws.compute import EC2

with Diagram("Simple Diagram"):
EC2("web")
In the above example, a node of the resource type EC2 provided by the provider. computeaws You can use other node objects in a similar way, for example:
# aws resources
from diagrams.aws.compute import ECS, Lambda
from diagrams.aws.database import RDS, ElastiCache
from diagrams.aws.network import ELB, Route53, VPC
...

# azure resources
from diagrams.azure.compute import FunctionApps
from diagrams.azure.storage import BlobStorage
...

# alibaba cloud resources
from diagrams.alibabacloud.compute import ECS
from diagrams.alibabacloud.storage import ObjectTableStore
...

# gcp resources
from diagrams.gcp.compute import AppEngine, GKE
from diagrams.gcp.ml import AutoML
...

# k8s resources
from diagrams.k8s.compute import Pod, StatefulSet
from diagrams.k8s.network import Service
from diagrams.k8s.storage import PV, PVC, StorageClass
...

# oracle resources
from diagrams.oci.compute import VirtualMachine, Container
from diagrams.oci.network import Firewall
from diagrams.oci.storage import FileStorage, StorageGateway
You can represent a data stream by connecting nodes using the following operators > > : < < And -.
- > > : Connect nodes from left to right.
- < < : Connect nodes from right to left.
- – : No direction connected nodes. Not directed.
from diagrams import Diagram
from diagrams.aws.compute import EC2
from diagrams.aws.database import RDS
from diagrams.aws.network import ELB
from diagrams.aws.storage import S3

with Diagram("Web Services", show=False):
    ELB("lb") >> EC2("web") >> RDS("userdb") >> S3("store")
    ELB("lb") >> EC2("web") >> RDS("userdb") << EC2("stat")
    (ELB("lb") >> EC2("web")) - EC2("web") >> RDS("userdb")
cluster
Cluster represents the local Cluster context, which you can create using the cluster class. You can also connect nodes in a cluster to other nodes outside the cluster.
from diagrams import Cluster, Diagram
from diagrams.aws.compute import ECS
from diagrams.aws.database import RDS
from diagrams.aws.network import Route53

with Diagram("Simple Web Service with DB Cluster", show=False):
    dns = Route53("dns")
    web = ECS("service")

    with Cluster("DB Cluster"):
        db_primary = RDS("primary")
        db_primary - [RDS("replica1"),
                     RDS("replica2")]

    dns >> web >> db_primary
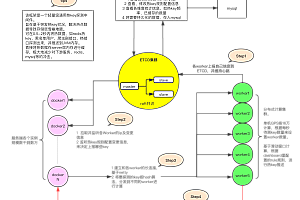
edge
Edge is an object that represents a connection between nodes with some additional attributes. Edge objects contain three properties: label , color , and style , which reflect the corresponding graphviz edge properties.
from diagrams import Cluster, Diagram, Edge
from diagrams.onprem.analytics import Spark
from diagrams.onprem.compute import Server
from diagrams.onprem.database import PostgreSQL
from diagrams.onprem.inmemory import Redis
from diagrams.onprem.aggregator import Fluentd
from diagrams.onprem.monitoring import Grafana, Prometheus
from diagrams.onprem.network import Nginx
from diagrams.onprem.queue import Kafka

with Diagram(name="Advanced Web Service with On-Premise (colored)", show=False):
    ingress = Nginx("ingress")

    metrics = Prometheus("metric")
    metrics << Edge(color="firebrick", style="dashed") << Grafana("monitoring")

    with Cluster("Service Cluster"):
        grpcsvc = [
            Server("grpc1"),
            Server("grpc2"),
            Server("grpc3")]

    with Cluster("Sessions HA"):
        primary = Redis("session")
        primary \
            - Edge(color="brown", style="dashed") \
            - Redis("replica") \
            << Edge(label="collect") \
            << metrics
        grpcsvc >> Edge(color="brown") >> primary

    with Cluster("Database HA"):
        primary = PostgreSQL("users")
        primary \
            - Edge(color="brown", style="dotted") \
            - PostgreSQL("replica") \
            << Edge(label="collect") \
            << metrics
        grpcsvc >> Edge(color="black") >> primary

    aggregator = Fluentd("logging")
    aggregator \
        >> Edge(label="parse") \
        >> Kafka("stream") \
        >> Edge(color="black", style="bold") \
        >> Spark("analytics")

    ingress \
        >> Edge(color="darkgreen") \
        << grpcsvc \
        >> Edge(color="darkorange") \
        >> aggregator
—END—
Open source License: MIT License