This issue recommends an open source data visualization analysis platform——DataGear。

DataGear is an open source data visualization analysis platform, you can freely make any data visualization Kanban you want, support access to SQL, CSV, Excel, HTTP interface, JSON and other data sources. The main functions of the system include: data management, SQL workbench, data import/export, data set management, chart management, Kanban management, etc.
functional characteristics
- Dynamic access to multiple data sources
Supports dynamic access to any database that provides the JDBC driver, including relational databases such as MySQL, Oracle, PostgreSQL, and SQL Server, and big data engines such as Elasticsearch, ClickHouse, and Hive.
- Supports data sets in multiple formats
You can create SQL, CSV, Excel, HTTP interface, and JSON data sets, define data sets as dynamic parameterized data sets, and add data set parameters such as text boxes, drop-down boxes, date boxes, and time boxes to support the construction of dynamic interactive charts.
- Rich and powerful chart function
Charts can aggregate multiple data sets in different formats, easily build year-on-year and quarter-on-month data charts, built-in line charts, bar charts, pie charts, maps, radar charts, funnel charts, scatter charts, K charts, Sankey charts and other 50+ out-of-the-box charts, and support custom chart configuration items, support to write and upload custom chart plug-ins.
- Freely editable data visualization page
The visual page uses the native HTML web page as a template, you can freely edit the page content, import any HTML web page, add extended attributes to the elements to bind and configure charts, the page built-in rich API, you can build chart linkage, data drilling, asynchronous loading, interactive forms and other personalized data visualization pages.
architecture diagram

install DataGear
1.Install the JRE
JRE 1.8 or later is required.
2. Download the latest software package
site:
https://gitee.com/datagear/datagear/attach_files/850057/download/datagear-2.9.0.zip
3. Unzip package
When extracted, a folder named datagear-[version] is generated
4. Start service
- Linux:execute datagear-[version]/startup.sh
- Windows:execute datagear-[version]/startup.bat
5. Open from browser
import:http://localhost:50401
6. Other notes:
- At first, the system has a built-in administrator account. The account name and password are admin
- All data of the system is stored in the [user home directory]/.datagear folder. Please back up this folder when necessary.
- The system database uses the built-in Derby database, stored in the [user home directory]/.datagEAR /derby folder.
- System default to allow anonymous users to access and use, in the config/application. The properties set disableAnonymous configuration items can disable this feature. Example:
disableAnonymous=true- The default system allows the user to the independent registered in the config/application. The properties set disableRegister configuration items can disable this feature. Example:
disableRegister=true- System default allow anonymous users to use all of its functions in the config/application. The properties set defaultRole. Anonymous configuration items can be adjusted this feature. The following configuration example gives anonymous users only permission to browse data, but no permission to create or edit data:
defaultRole.anonymous=ROLE_DATA_ANALYSTGet started
1. Creating a Data Source (optional)
Click the + button under the Data Source column in the upper left corner of the home page to create a new data source, such as MySQL:

2. Create a new SQL data set (optional, perform this operation when a new data source is created)
Click the Data Set entry under Data Analysis in the upper left corner of the home page to add a SQL dataset:

3. Create a new JSON data set (optional, perform this operation if no new data source is created)
Click on the Data set entry under Data Analysis in the upper left corner of the home page to add a JSON data set:

4.new chart
Click on the Chart entry under the Data Analysis column in the upper left corner of the home page and add two charts, a bar chart and a pie chart:


5. Presentation chart
Click the “Save and display” button on the above Add chart page to see the chart display effect:


6. New signage
Click on the “Kanban” entry under the “Data Analysis” column in the upper left corner of the main page, add a Kanban, and add two <div> elements inside the Kanban template content <body></body> element:
<html>
<head>
...
</head>
<body>
  <div class="dg-chart" dg-chart-widget="Above bar chart chart ID"></div>
  <div class="dg-chart" dg-chart-widget="Above bar chart chart ID"></div>
</body>
</html>
Alternatively, click the “Insert Chart” button, select the above two charts, and automatically insert these two elements, as shown below:

7. Display board
Click the “Save and display” button on the page above to see the Kanban display effect:

Interface example
- large-size screen monitors


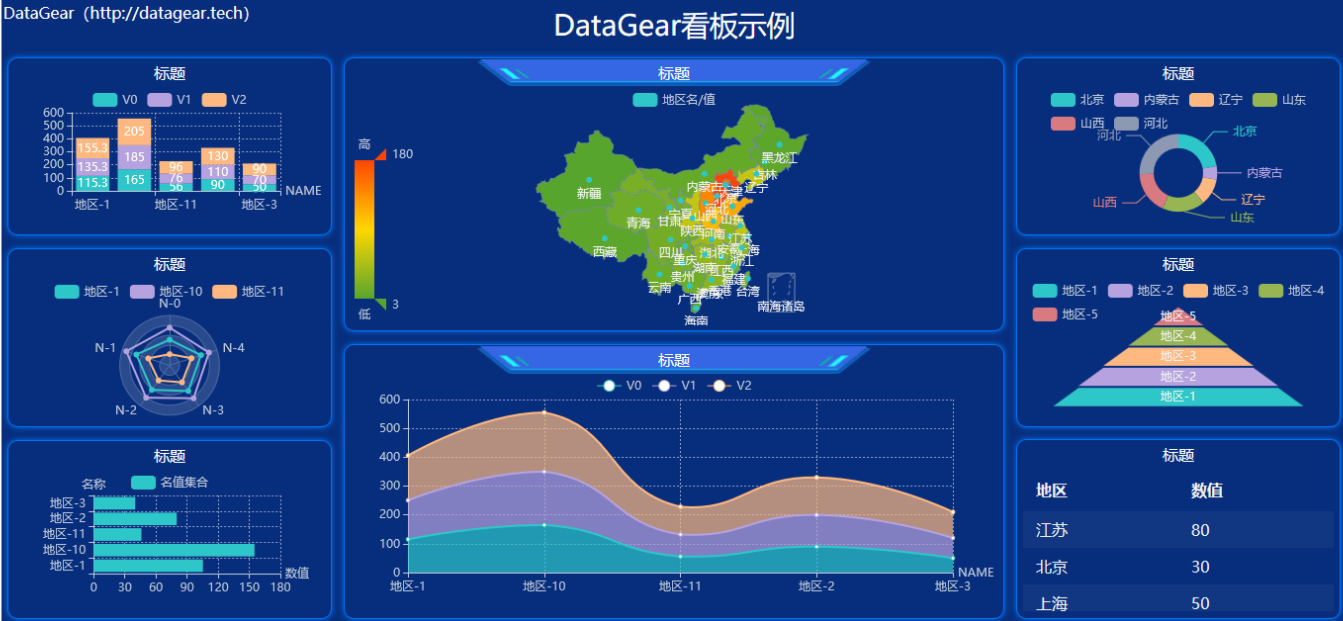

- Map linkage

- Filter by block

- Chart interaction

- Dark theme

- data administration


Large screen template
In addition, datagear also prefabricated a variety of static large screen HTML templates, which can be used as Kanban templates to import DataGear data visualization analysis platform and make large screen display data visualization Kanban.
Template address:
https://gitee.com/datagear/DataGearDashboardTemplate
Effect drawing:


You can read more on your own.

