An open source data visualization analysis platform, providing a variety of large screen templates

An open source data visualization analysis platform, providing a variety of large screen templates

2022-09-02 0 1,015
Resource Number 38011 Last Updated 2025-02-24
¥ 0HKD Upgrade VIP
Download Now Matters needing attention
Can't download? Please contact customer service to submit a link error!
Value-added Service: Installation Guide Environment Configuration Secondary Development Template Modification Source Code Installation

This issue recommends an open source data visualization analysis platform——DataGear。
An open source data visualization analysis platform, providing a variety of large screen templates插图

DataGear is an open source data visualization analysis platform, you can freely make any data visualization Kanban you want, support access to SQL, CSV, Excel, HTTP interface, JSON and other data sources. The main functions of the system include: data management, SQL workbench, data import/export, data set management, chart management, Kanban management, etc.

functional characteristics

  • Dynamic access to multiple data sources

Supports dynamic access to any database that provides the JDBC driver, including relational databases such as MySQL, Oracle, PostgreSQL, and SQL Server, and big data engines such as Elasticsearch, ClickHouse, and Hive.

  • Supports data sets in multiple formats

You can create SQL, CSV, Excel, HTTP interface, and JSON data sets, define data sets as dynamic parameterized data sets, and add data set parameters such as text boxes, drop-down boxes, date boxes, and time boxes to support the construction of dynamic interactive charts.

  • Rich and powerful chart function

Charts can aggregate multiple data sets in different formats, easily build year-on-year and quarter-on-month data charts, built-in line charts, bar charts, pie charts, maps, radar charts, funnel charts, scatter charts, K charts, Sankey charts and other 50+ out-of-the-box charts, and support custom chart configuration items, support to write and upload custom chart plug-ins.

  • Freely editable data visualization page

The visual page uses the native HTML web page as a template, you can freely edit the page content, import any HTML web page, add extended attributes to the elements to bind and configure charts, the page built-in rich API, you can build chart linkage, data drilling, asynchronous loading, interactive forms and other personalized data visualization pages.

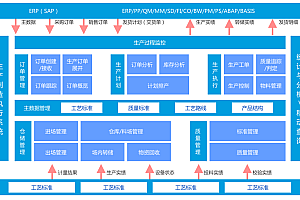
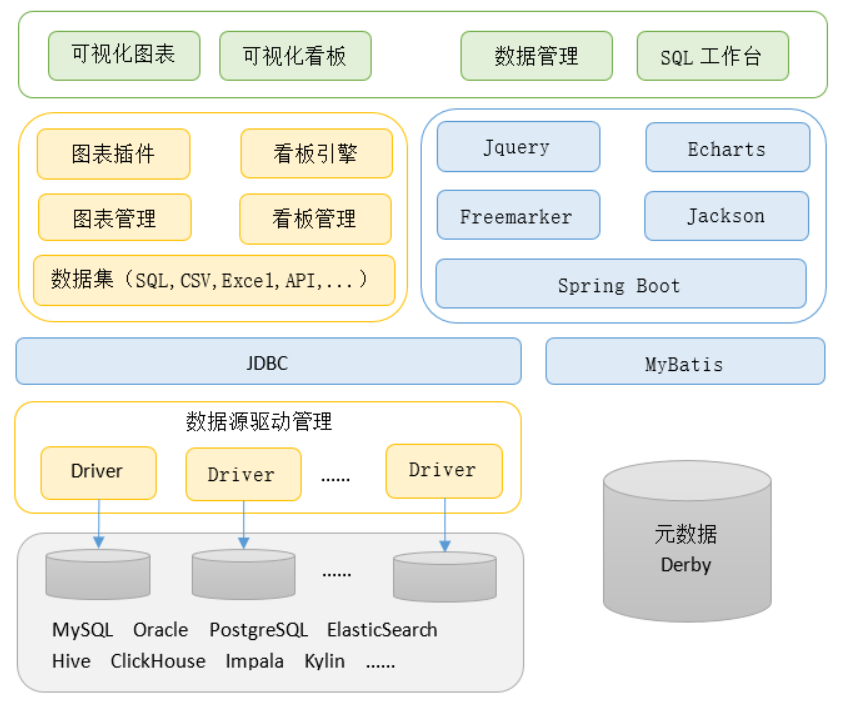
architecture diagram
An open source data visualization analysis platform, providing a variety of large screen templates插图1

install DataGear

1.Install the JRE

JRE 1.8 or later is required.

2. Download the latest software package

site:
https://gitee.com/datagear/datagear/attach_files/850057/download/datagear-2.9.0.zip

3. Unzip package

When extracted, a folder named datagear-[version] is generated

4. Start service

  • Linux:execute datagear-[version]/startup.sh
  • Windows:execute datagear-[version]/startup.bat

5. Open from browser

import:http://localhost:50401

6. Other notes:

  • At first, the system has a built-in administrator account. The account name and password are admin
  • All data of the system is stored in the [user home directory]/.datagear folder. Please back up this folder when necessary.
  • The system database uses the built-in Derby database, stored in the [user home directory]/.datagEAR /derby folder.
  • System default to allow anonymous users to access and use, in the config/application. The properties set disableAnonymous configuration items can disable this feature. Example:
disableAnonymous=true
  • The default system allows the user to the independent registered in the config/application. The properties set disableRegister configuration items can disable this feature. Example:
disableRegister=true
  • System default allow anonymous users to use all of its functions in the config/application. The properties set defaultRole. Anonymous configuration items can be adjusted this feature. The following configuration example gives anonymous users only permission to browse data, but no permission to create or edit data:
defaultRole.anonymous=ROLE_DATA_ANALYST

Get started

1. Creating a Data Source (optional)

Click the + button under the Data Source column in the upper left corner of the home page to create a new data source, such as MySQL:
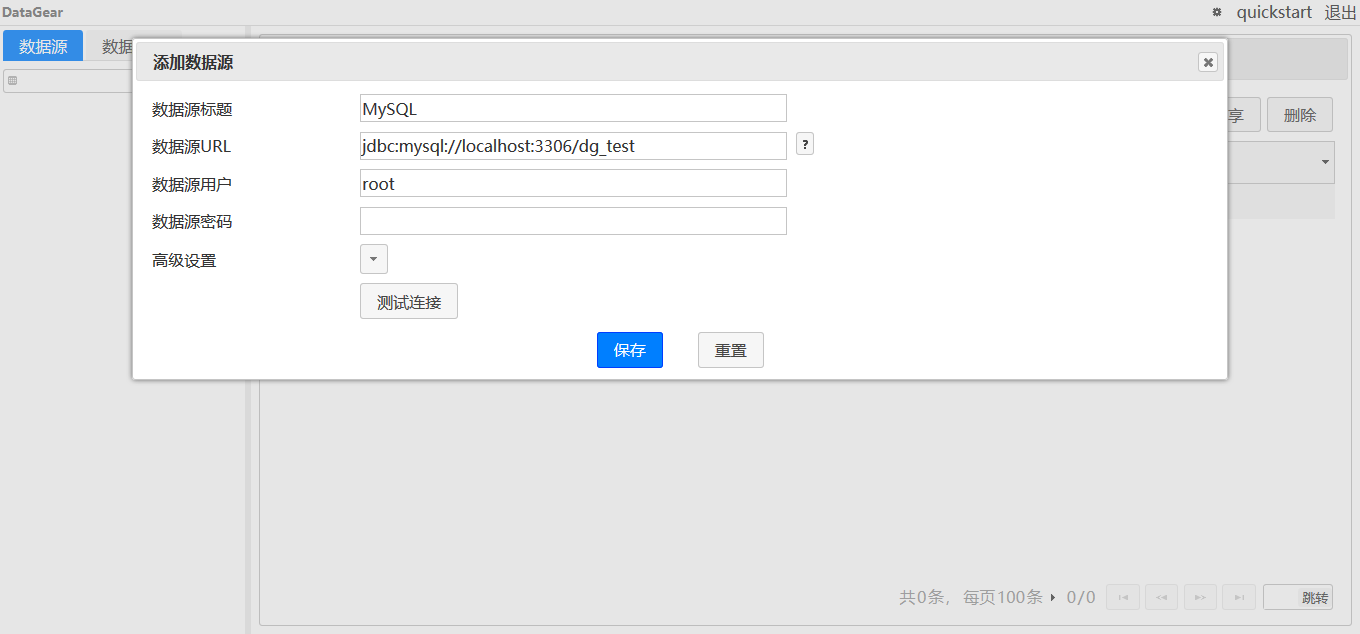
An open source data visualization analysis platform, providing a variety of large screen templates插图2

2. Create a new SQL data set (optional, perform this operation when a new data source is created)

Click the Data Set entry under Data Analysis in the upper left corner of the home page to add a SQL dataset:
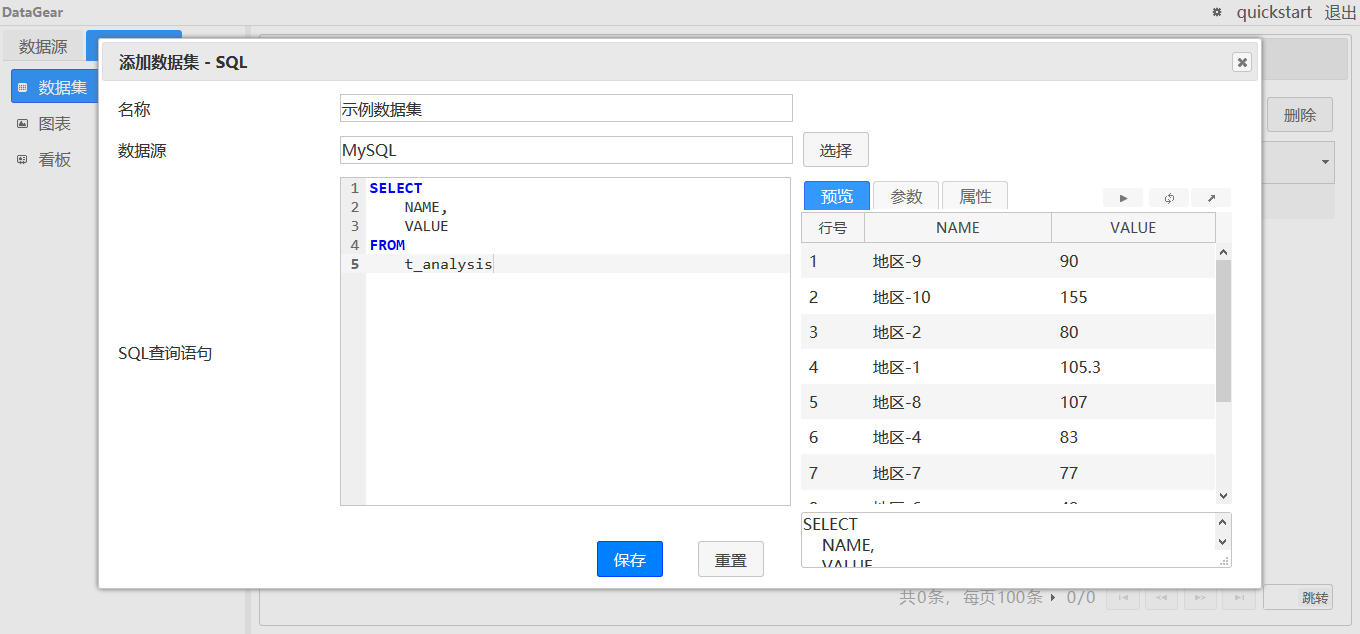
An open source data visualization analysis platform, providing a variety of large screen templates插图3

3. Create a new JSON data set (optional, perform this operation if no new data source is created)

Click on the Data set entry under Data Analysis in the upper left corner of the home page to add a JSON data set:

An open source data visualization analysis platform, providing a variety of large screen templates插图4

4.new chart

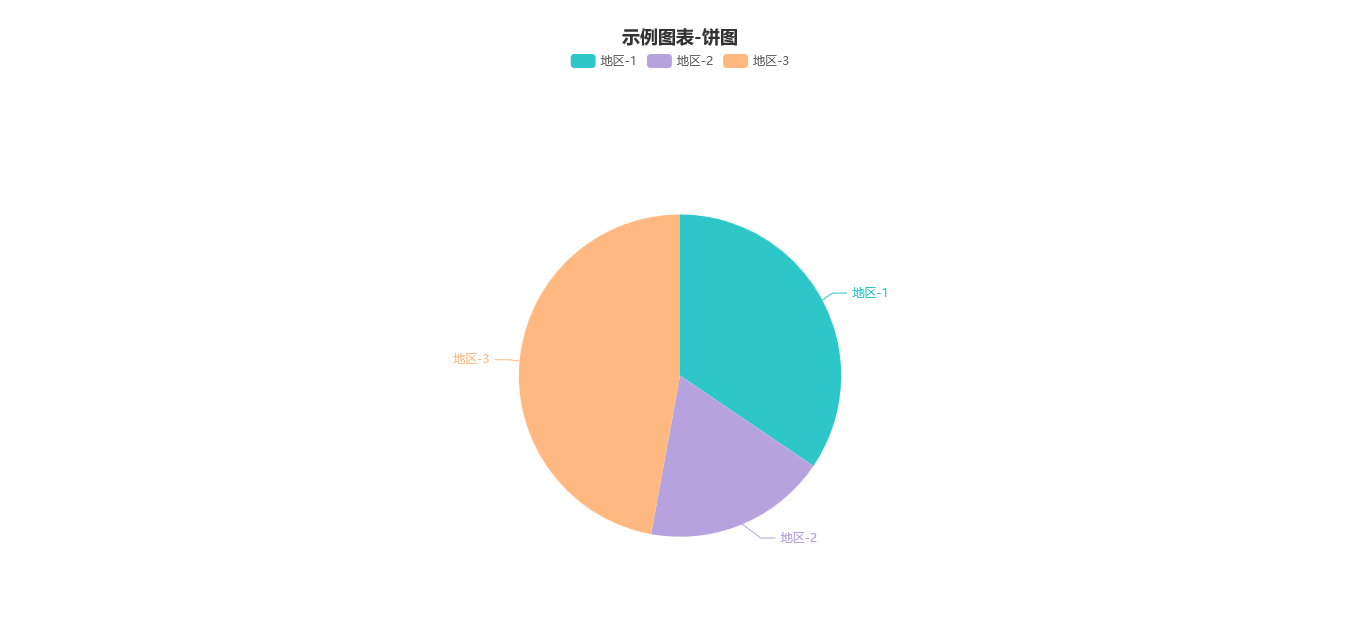
Click on the Chart entry under the Data Analysis column in the upper left corner of the home page and add two charts, a bar chart and a pie chart:
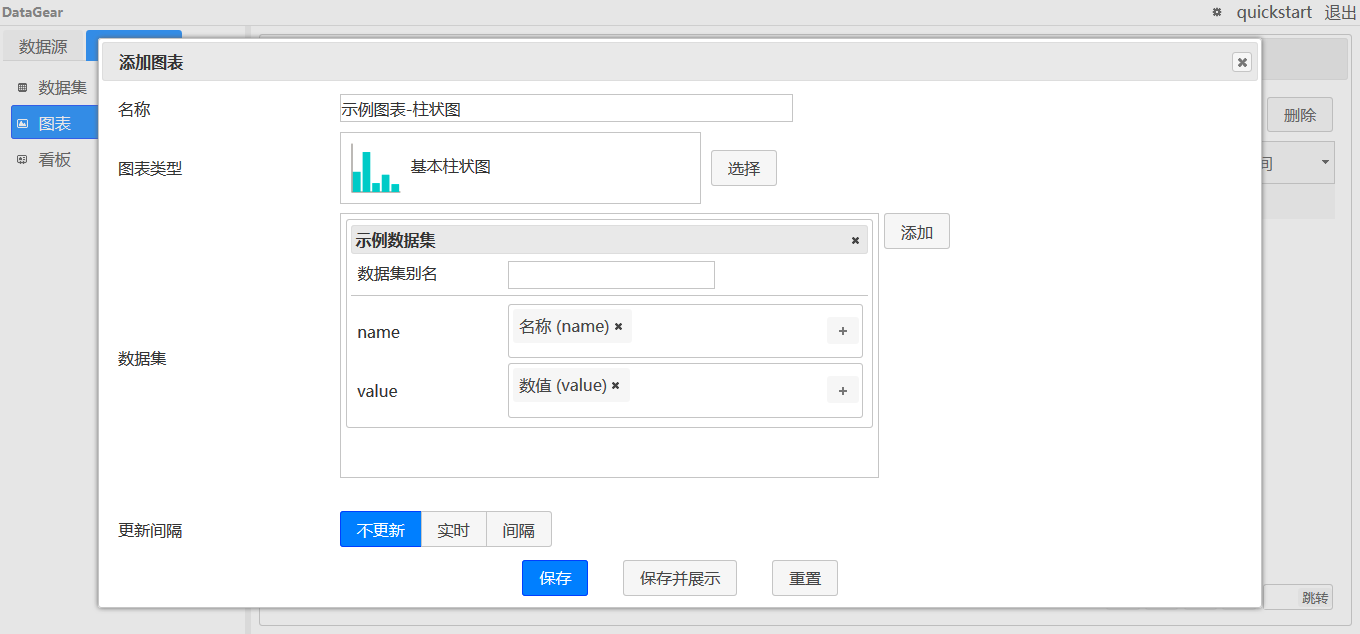
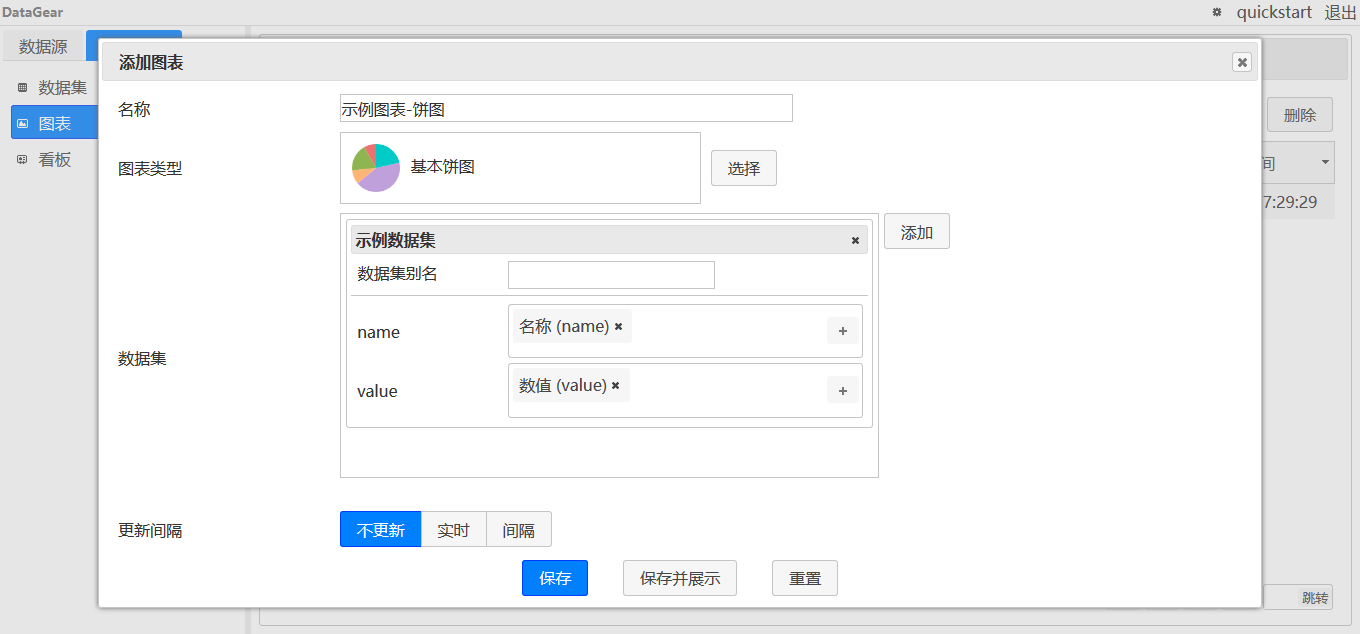
An open source data visualization analysis platform, providing a variety of large screen templates插图5

An open source data visualization analysis platform, providing a variety of large screen templates插图6

5. Presentation chart

Click the “Save and display” button on the above Add chart page to see the chart display effect:
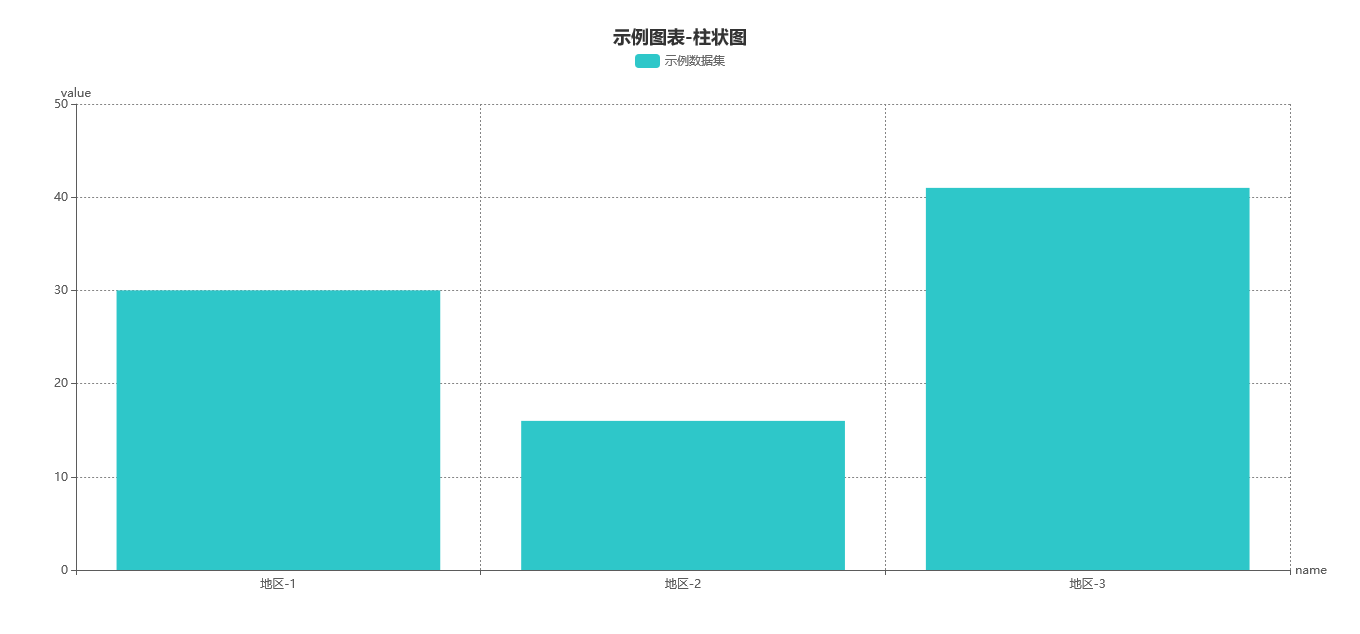
An open source data visualization analysis platform, providing a variety of large screen templates插图7

An open source data visualization analysis platform, providing a variety of large screen templates插图8

6. New signage

Click on the “Kanban” entry under the “Data Analysis” column in the upper left corner of the main page, add a Kanban, and add two <div> elements inside the Kanban template content <body></body> element:

<html>
<head>
...
</head>
<body>
  <div class="dg-chart" dg-chart-widget="Above bar chart chart ID"></div> 
  <div class="dg-chart" dg-chart-widget="Above bar chart chart ID"></div>
</body>
</html>

Alternatively, click the “Insert Chart” button, select the above two charts, and automatically insert these two elements, as shown below:
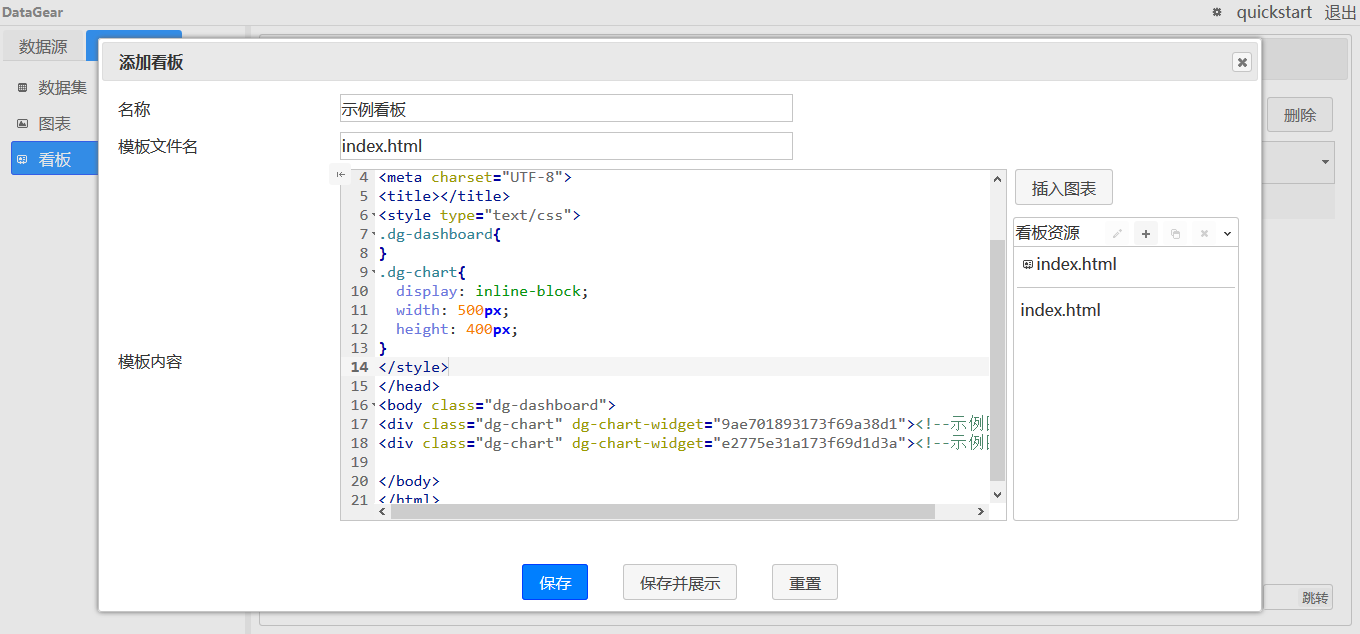
An open source data visualization analysis platform, providing a variety of large screen templates插图9

7. Display board

Click the “Save and display” button on the page above to see the Kanban display effect:
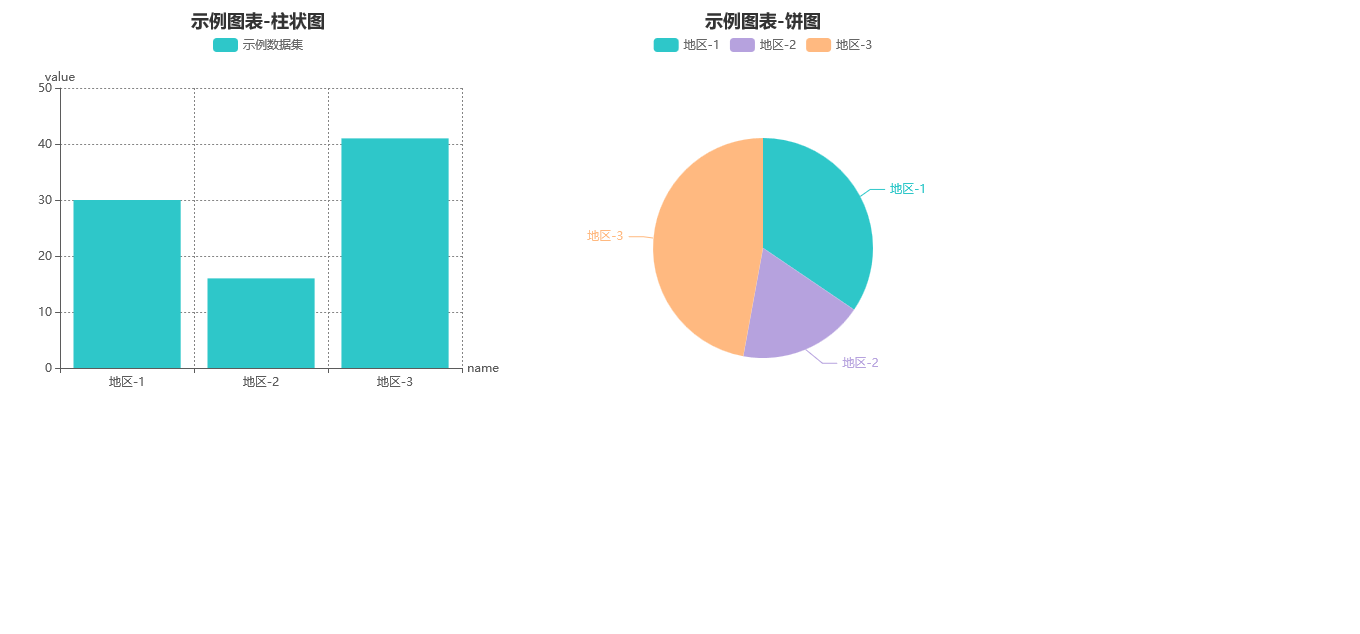
An open source data visualization analysis platform, providing a variety of large screen templates插图10

Interface example

  • large-size screen monitors

An open source data visualization analysis platform, providing a variety of large screen templates插图11

An open source data visualization analysis platform, providing a variety of large screen templates插图12

4459fb8da739435c8ddcd49f28a82ab7noop.image_

An open source data visualization analysis platform, providing a variety of large screen templates插图14

  • Map linkage

An open source data visualization analysis platform, providing a variety of large screen templates插图15

  • Filter by block

An open source data visualization analysis platform, providing a variety of large screen templates插图16

  • Chart interaction

An open source data visualization analysis platform, providing a variety of large screen templates插图17

  • Dark theme

An open source data visualization analysis platform, providing a variety of large screen templates插图18

  • data administration

An open source data visualization analysis platform, providing a variety of large screen templates插图19

An open source data visualization analysis platform, providing a variety of large screen templates插图20

An open source data visualization analysis platform, providing a variety of large screen templates插图21

Large screen template

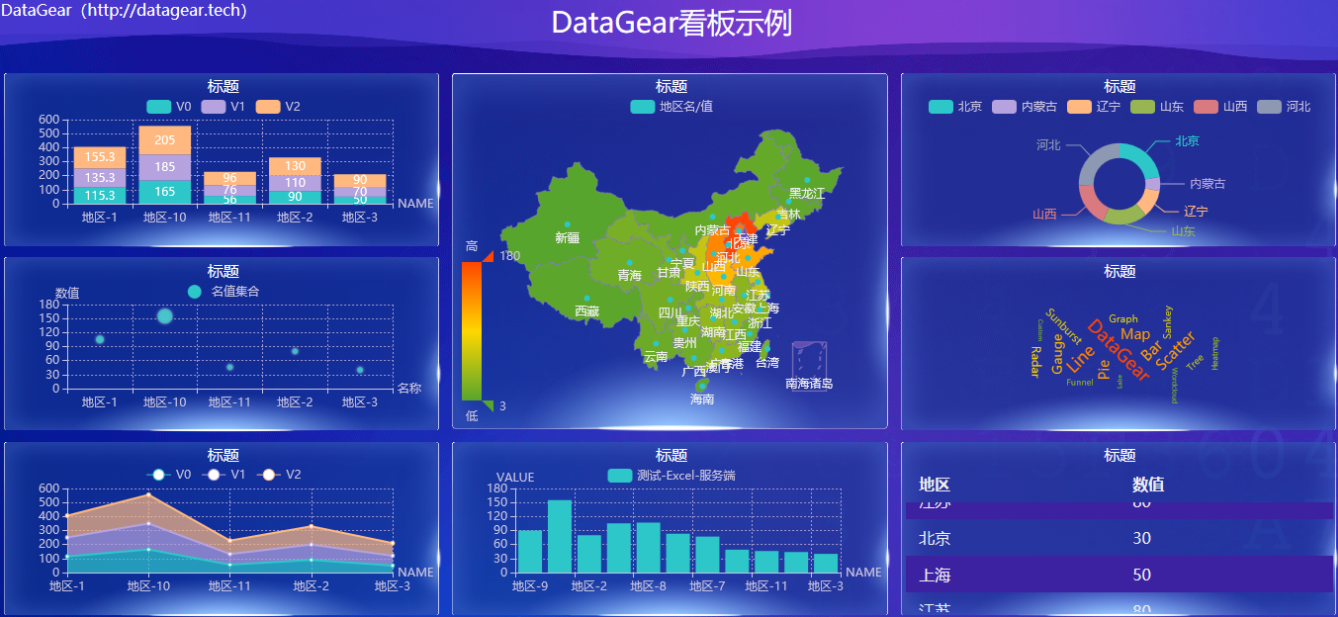
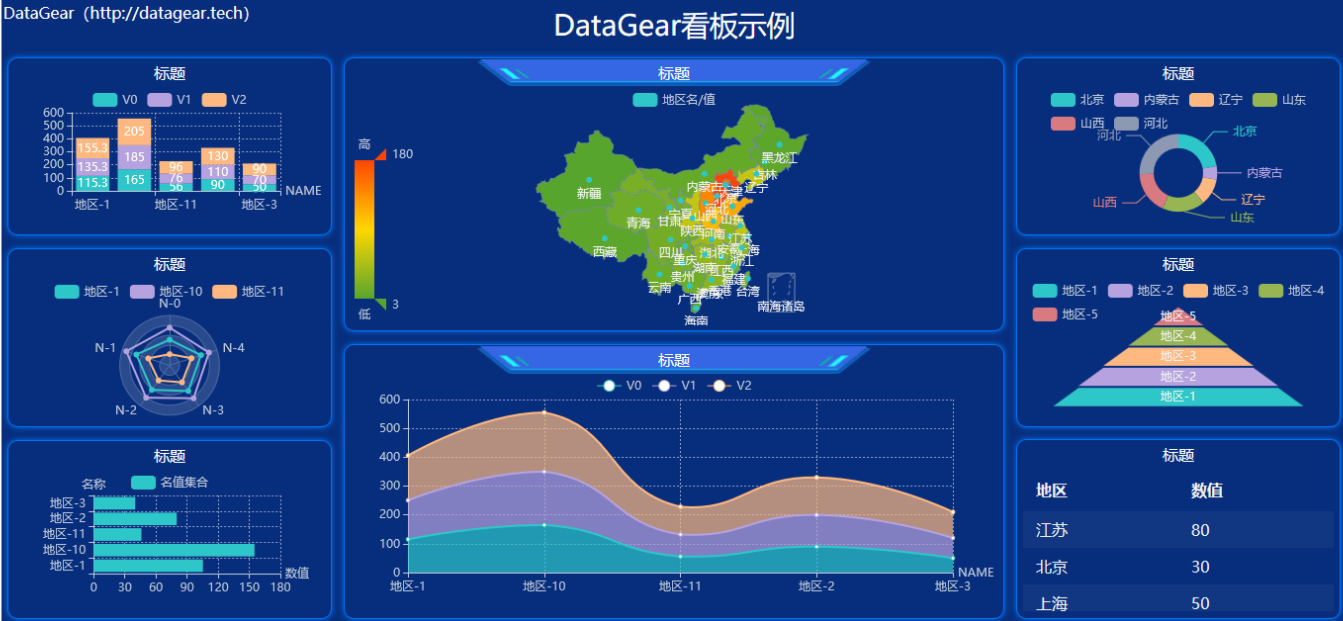
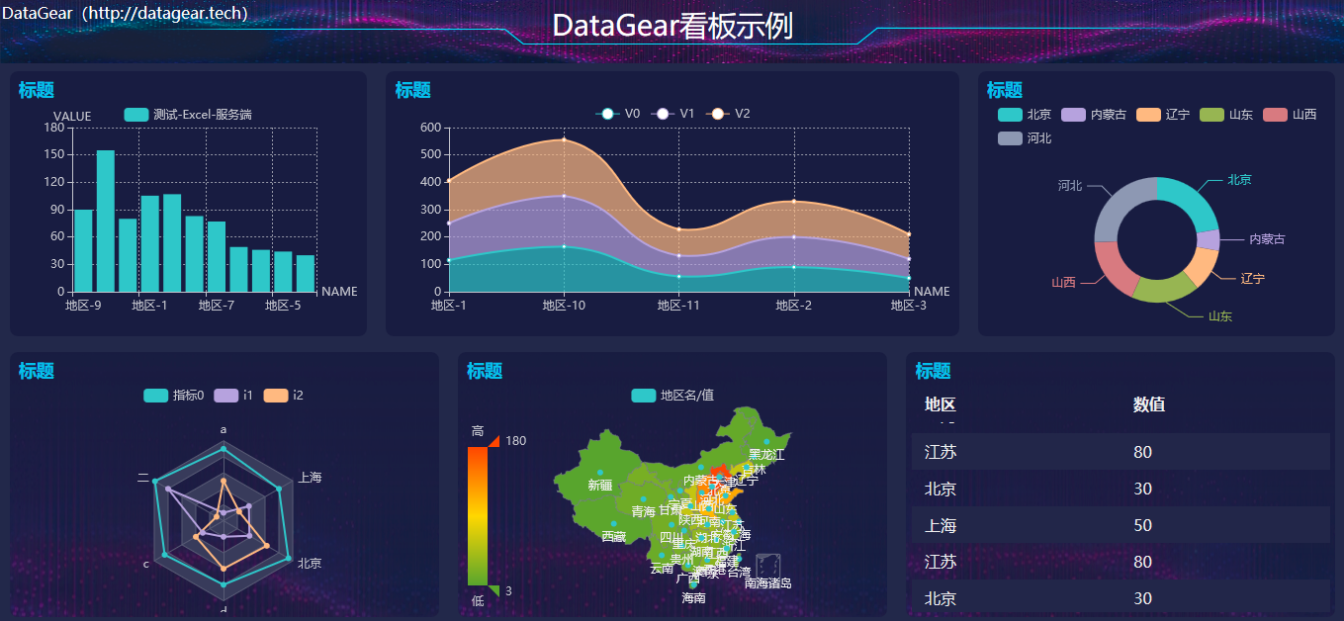
In addition, datagear also prefabricated a variety of static large screen HTML templates, which can be used as Kanban templates to import DataGear data visualization analysis platform and make large screen display data visualization Kanban.

Template address:
https://gitee.com/datagear/DataGearDashboardTemplate

Effect drawing:

An open source data visualization analysis platform, providing a variety of large screen templates插图22

An open source data visualization analysis platform, providing a variety of large screen templates插图23

An open source data visualization analysis platform, providing a variety of large screen templates插图24

An open source data visualization analysis platform, providing a variety of large screen templates插图25

You can read more on your own.
资源下载此资源为免费资源立即下载
Telegram:@John_Software

Disclaimer: This article is published by a third party and represents the views of the author only and has nothing to do with this website. This site does not make any guarantee or commitment to the authenticity, completeness and timeliness of this article and all or part of its content, please readers for reference only, and please verify the relevant content. The publication or republication of articles by this website for the purpose of conveying more information does not mean that it endorses its views or confirms its description, nor does it mean that this website is responsible for its authenticity.

Ictcoder Free Source Code An open source data visualization analysis platform, providing a variety of large screen templates https://ictcoder.com/an-open-source-data-visualization-analysis-platform-providing-a-variety-of-large-screen-templates/

Share free open-source source code

Q&A
  • 1. Automatic: After making an online payment, click the (Download) link to download the source code; 2. Manual: Contact the seller or the official to check if the template is consistent. Then, place an order and make payment online. The seller ships the goods, and both parties inspect and confirm that there are no issues. ICTcoder will then settle the payment for the seller. Note: Please ensure to place your order and make payment through ICTcoder. If you do not place your order and make payment through ICTcoder, and the seller sends fake source code or encounters any issues, ICTcoder will not assist in resolving them, nor can we guarantee your funds!
View details
  • 1. Default transaction cycle for source code: The seller manually ships the goods within 1-3 days. The amount paid by the user will be held in escrow by ICTcoder until 7 days after the transaction is completed and both parties confirm that there are no issues. ICTcoder will then settle with the seller. In case of any disputes, ICTcoder will have staff to assist in handling until the dispute is resolved or a refund is made! If the buyer places an order and makes payment not through ICTcoder, any issues and disputes have nothing to do with ICTcoder, and ICTcoder will not be responsible for any liabilities!
View details
  • 1. ICTcoder will permanently archive the transaction process between both parties and snapshots of the traded goods to ensure the authenticity, validity, and security of the transaction! 2. ICTcoder cannot guarantee services such as "permanent package updates" and "permanent technical support" after the merchant's commitment. Buyers are advised to identify these services on their own. If necessary, they can contact ICTcoder for assistance; 3. When both website demonstration and image demonstration exist in the source code, and the text descriptions of the website and images are inconsistent, the text description of the image shall prevail as the basis for dispute resolution (excluding special statements or agreements); 4. If there is no statement such as "no legal basis for refund" or similar content, any indication on the product that "once sold, no refunds will be supported" or other similar declarations shall be deemed invalid; 5. Before the buyer places an order and makes payment, the transaction details agreed upon by both parties via WhatsApp or email can also serve as the basis for dispute resolution (in case of any inconsistency between the agreement and the description of the conflict, the agreement shall prevail); 6. Since chat records and email records can serve as the basis for dispute resolution, both parties should only communicate with each other through the contact information left on the system when contacting each other, in order to prevent the other party from denying their own commitments. 7. Although the probability of disputes is low, it is essential to retain important information such as chat records, text messages, and email records, in case a dispute arises, so that ICTcoder can intervene quickly.
View details
  • 1. As a third-party intermediary platform, ICTcoder solely protects transaction security and the rights and interests of both buyers and sellers based on the transaction contract (product description, agreed content before the transaction); 2. For online trading projects not on the ICTcoder platform, any consequences are unrelated to this platform; regardless of the reason why the seller requests an offline transaction, please contact the administrator to report.
View details

Related Source code

ICTcoder Customer Service

24-hour online professional services