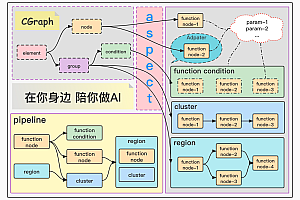
This issue recommends an open-source table visualization engine from Ant Experience Technology – S2</ p>

S2 is AntV’s solution in the field of multidimensional cross analysis tables, based entirely on a data-driven approach. By providing underlying capability libraries, basic components, business scenario components, and the ability to freely extend, developers can freely choose based on their own scenarios, both out of the box and freely unleash their potential</ p>
Features
- Multidimensional cross analysis: Say goodbye to a single analytical dimension and fully embrace the free combination analysis of any dimension
- High performance: capable of supporting millions of data at full capacity<; 8s rendering, and second level rendering can also be achieved through local drilling
- High scalability: supports any custom extension (including but not limited to layout, style, interaction, data hook flow, etc.)
- Ready to use: Provides React, Vue3 version table components and supporting analysis components that can be used out of the box in different analysis scenarios. With simple configuration, complex scene table rendering can be easily achieved
- Interactivity: Supports rich forms of interaction (single choice, circle selection, row selection, column selection, frozen row header, width and height drag, custom interaction, etc.)
Install and use
1 Installation
$ npm install @antv/s2
# yarn add @antv/s2
2 Data Preparation
const s2DataConfig = {
fields: {
rows: ['province', 'city'],
columns: ['type'],
values: ['price'],
},
data: [
{
Province:'Zhejiang',
City:'Hangzhou',
type:"pen",
price: '1',
},
{
Province:'Zhejiang',
City:'Hangzhou',
type:'Paper',
price: '2',
},
{
Province:'Zhejiang',
City:'Zhoushan',
type:"pen",
price: '17',
},
{
Province:'Zhejiang',
City:'Zhoushan',
type:'Paper',
price: '0.5',
},
{
Province:'Jilin',
City:'Dandong',
type:"pen",
price: '8',
},
{
Province:'Jilin',
City:'Baishan',
type:"pen",
price: '9',
},
{
Province:'Jilin',
City:'Dandong',
type:'Paper',
price: '3',
},
{
Province:'Jilin',
City:'Baishan',
type:'Paper',
price: '1',
},
],
};
3 Configuration Item Preparation
const s2Options = {
width: 600,
height: 600,
}
4 Rendering
<< span class="hljs-name">div id="container"></ span></< span class="hljs-name">div></ span>import { PivotSheet } from '@antv/s2';
const container = document.getElementById('container');
const s2 = new PivotSheet(container, s2DataConfig, s2Options);
s2.render();</ code>5 Results

Chart Example

Group drilling table

Proportion Table of Single Person Groups

Multi population comparison table

How do you want to spend a day

Performance Comparison Table

KPI Trend Table
—END—
Open source license: MIT